. 2000 Aug 29;97(18):10101-6.
doi: 10.1073/pnas.97.18.10101.

Singular value decomposition for genome-wide expression data processing and modeling

Affiliations

Singular value decomposition for genome-wide expression data processing and modeling

O Alter et al. Proc Natl Acad Sci U S A. .

Abstract

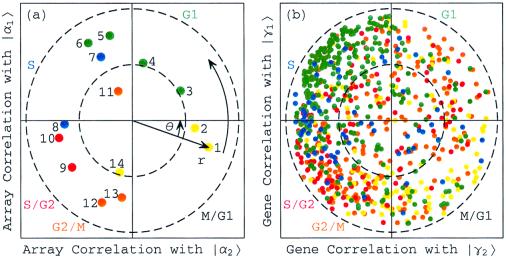
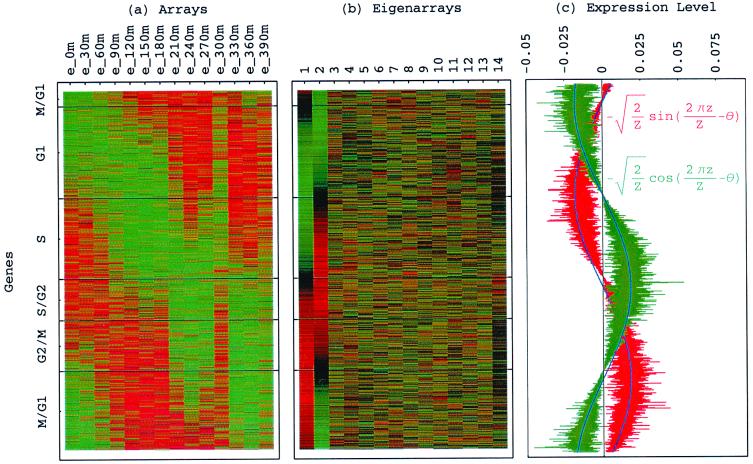
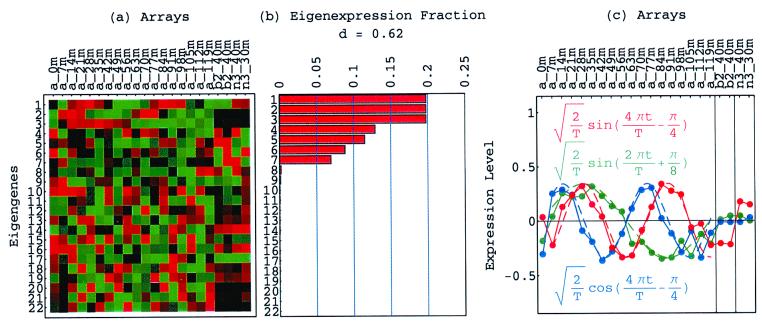
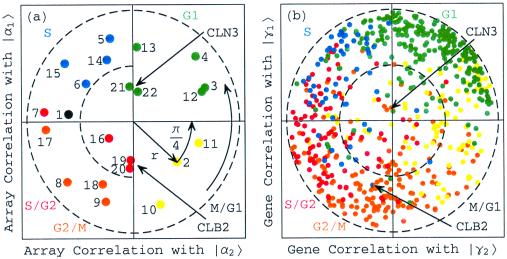
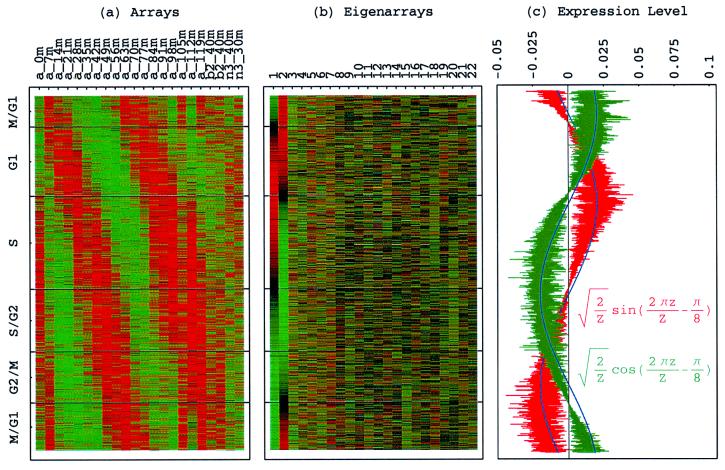
We describe the use of singular value decomposition in transforming genome-wide expression data from genes x arrays space to reduced diagonalized "eigengenes" x "eigenarrays" space, where the eigengenes (or eigenarrays) are unique orthonormal superpositions of the genes (or arrays). Normalizing the data by filtering out the eigengenes (and eigenarrays) that are inferred to represent noise or experimental artifacts enables meaningful comparison of the expression of different genes across different arrays in different experiments. Sorting the data according to the eigengenes and eigenarrays gives a global picture of the dynamics of gene expression, in which individual genes and arrays appear to be classified into groups of similar regulation and function, or similar cellular state and biological phenotype, respectively. After normalization and sorting, the significant eigengenes and eigenarrays can be associated with observed genome-wide effects of regulators, or with measured samples, in which these regulators are overactive or underactive, respectively.


Figures

Figure 1
Figure 1
Normalized elutriation eigengenes. (a) Raster display of v̂NT, the expression of 14 eigengenes in 14 arrays. (b) Bar chart of the fractions of eigenexpression, showing that |γ1N and |γ2N capture about 20% of the overall normalized expression each, and a high entropy d = 0.88. (c) Line-joined graphs of the expression levels of |γ1N (red) and |γ2N (blue) in the 14 arrays fit dashed graphs of normalized sine (red) and cosine (blue) of period T = 390 min and phase θ = 2π/13, respectively.
Figure 2
Figure 2
Normalized elutriation expression in the subspace associated with the cell cycle. (a) Array correlation with |α1N along the y-axis vs. that with |α2N along the x-axis, color-coded according to the classification of the arrays into the five cell cycle stages, M/G1 (yellow), G1 (green), S (blue), S/G2 (red), and G2/M (orange). The dashed unit and half-unit circles outline 100% and 25% of overall normalized array expression in the |α1N and |α2N subspace. (b) Correlation of each gene with |γ1N vs. that with |γ2N, for 784 cell cycle regulated genes, color-coded according to the classification by Spellman et al. (3).
Figure 3
Figure 3
Genes sorted by relative correlation with |γ1N and |γ2N of normalized elutriation. (a) Normalized elutriation expression of the sorted 5,981 genes in the 14 arrays, showing traveling wave of expression. (b) Eigenarrays expression; the expression of |α1N and |α2N, the eigenarrays corresponding to |γ1N and |γ2N, displays the sorting. (c) Expression levels of |α1N (red) and |α2N (green) fit normalized sine and cosine functions of period ZN − 1 = 5,980 and phase θ ≈ 2π/13 (blue), respectively.
Figure 4
Figure 4
Rotated normalized α factor, CLB2, and CLN3 eigengenes. (a) Raster display of RNT, where 1RN = R̂211N, |γ2RN = R̂12N, and |γ3RN = R̂23N. (b) |γ1RN, |γ2RN and |γ3RN capture 20% of the overall normalized expression each. (c) Expression levels of |γ1RN (red) and |γ2RN (blue) fit dashed graphs of normalized sine (red) and cosine (blue) of period T/2 = 66 min and phase π/4, respectively, and |γ3RN (green) fits dashed graph of normalized sine of period T = 112 min and phase −π/8, from t = 7 to t = 119 min during the cell cycle.
Figure 5
Figure 5
Rotated normalized α factor, CLB2, and CLN3 expression in the subspace associated with the cell cycle. (a) Array correlation with |α1RN along the y-axis vs. that with |α2RN along the x-axis, color-coded according to the classification of the arrays into the five cell cycle stages, M/G1 (yellow), G1 (green), S (blue), S/G2 (red), and G2/M (orange). The dashed unit and half-unit circles outline 100% and 25% of overall normalized array expression in the |α1RN and |α2RN subspace. (b) Correlation of each gene with |γ1RN vs. that with |γ2RN, for 638 cell cycle regulated genes, color-coded according to the classification by Spellman et al. (3).
Figure 6
Figure 6
Genes sorted by relative correlation with |γ1RN and |γ2RN of rotated normalized α factor, CLB2, and CLN3. (a) Normalized expression of the sorted 4,579 genes in the 22 arrays, showing traveling wave of expression from t = 0 to 119 min during the cell cycle and standing waves of expression in the CLB2- and CLN3-overactive arrays. (b) Eigenarrays expression; the expression of |α1RN and |α2RN, the eigenarrays corresponding to |γ1RN and |γ2RN, displays the sorting. (c) Expression levels of |α1RN (red) and |α2RN (green) fit normalized sine and cosine functions of period ZN − 1 = 4,578 and phase π/8 (blue), respectively.

References

    1. Fodor S P, Rava R P, Huang X C, Pease A C, Holmes C P, Adams C L. Nature (London) 1993;364:555–556. - PubMed
    1. Schena M, Shalon D, Davis R W, Brown P O. Science. 1995;270:467–470. - PubMed
    1. Spellman P T, Sherlock G, Zhang M Q, Iyer V R, Anders K, Eisen M B, Brown P O, Botstein D, Futcher B. Mol Biol Cell. 1998;9:3273–3297. - PMC - PubMed
    1. Roth F P, Hughes J D, Estep P W, Church G M. Nat Biotechnol. 1998;16:939–945. - PubMed
    1. Eisen M B, Spellman P T, Brown P O, Botstein D. Proc Natl Acad Sci USA. 1998;95:14863–14868. - PMC - PubMed

Publication types