. 2000 Sep 1;20(17):6619-30.
doi: 10.1523/JNEUROSCI.20-17-06619.2000.

Molecular underpinnings of motor pattern generation: differential targeting of shal and shaker in the pyloric motor system

Affiliations

Molecular underpinnings of motor pattern generation: differential targeting of shal and shaker in the pyloric motor system

D J Baro et al. J Neurosci. .

Abstract

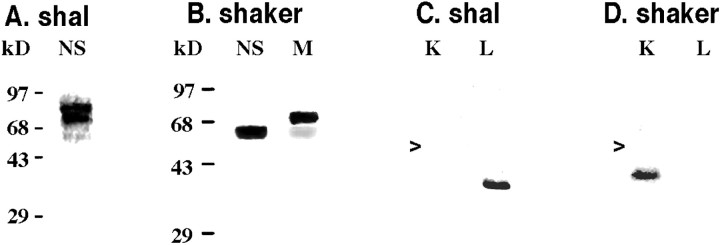
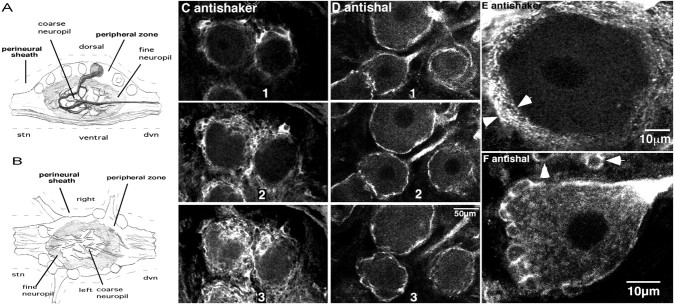
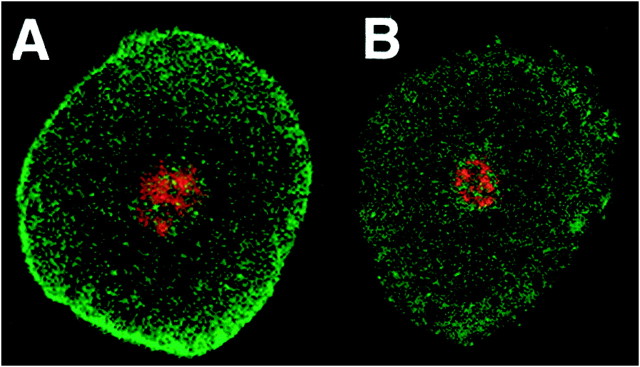
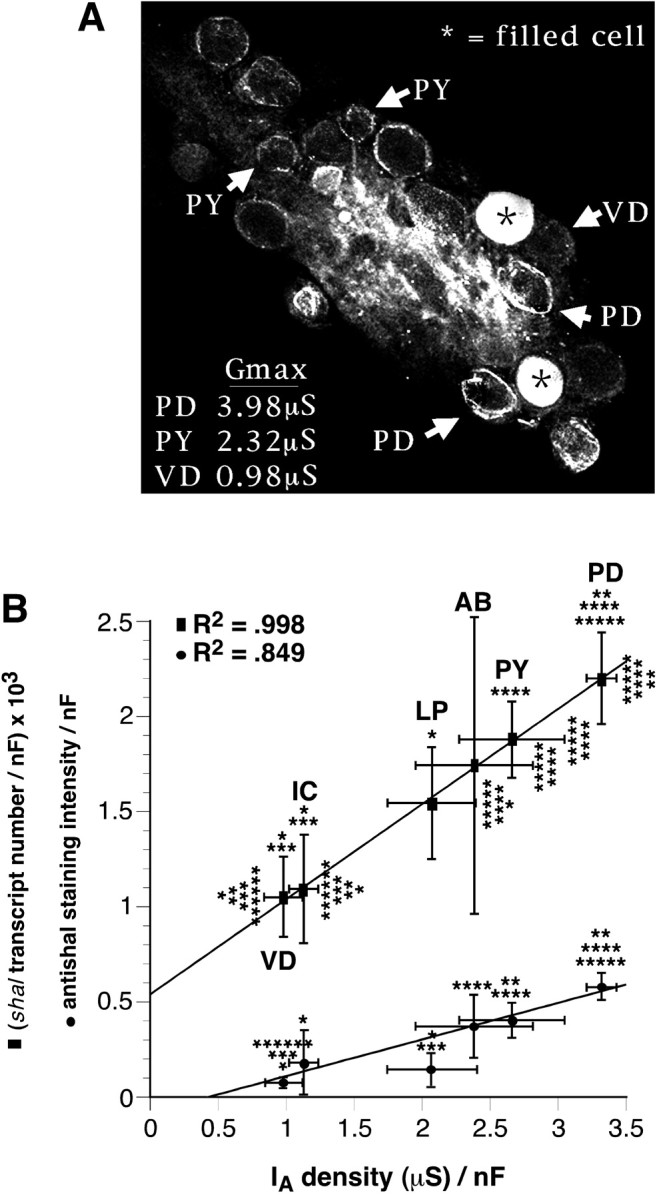
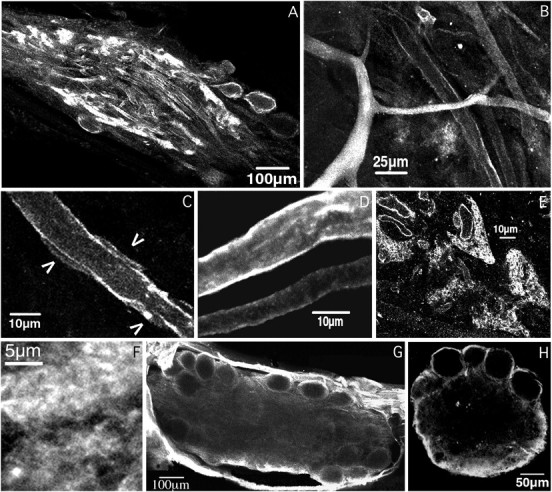
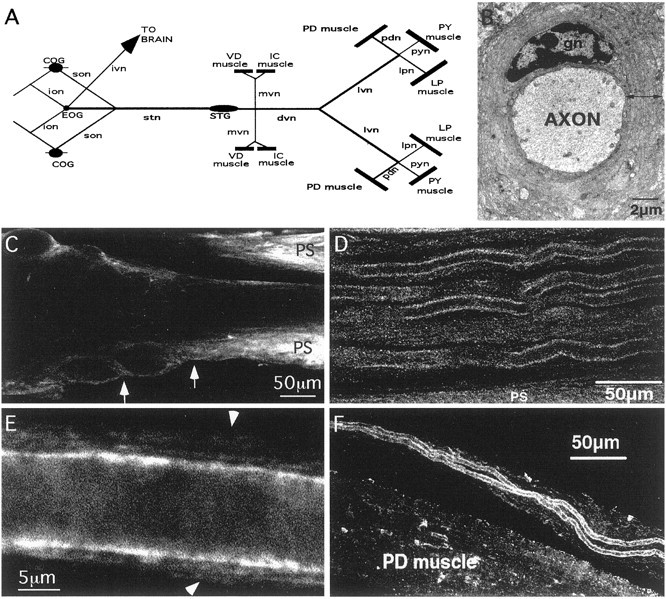
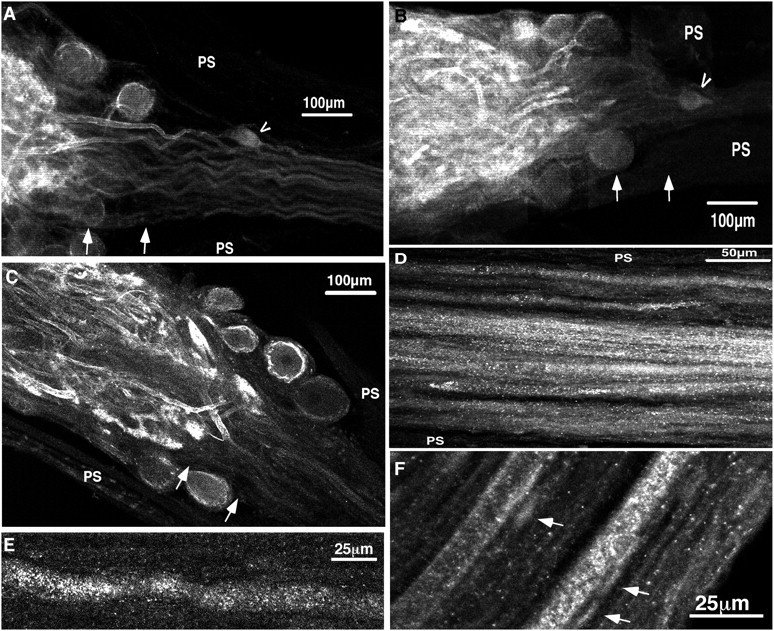
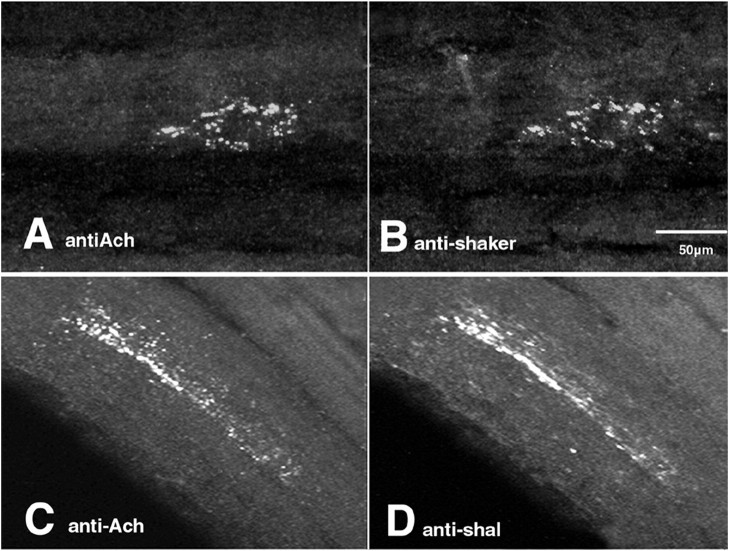
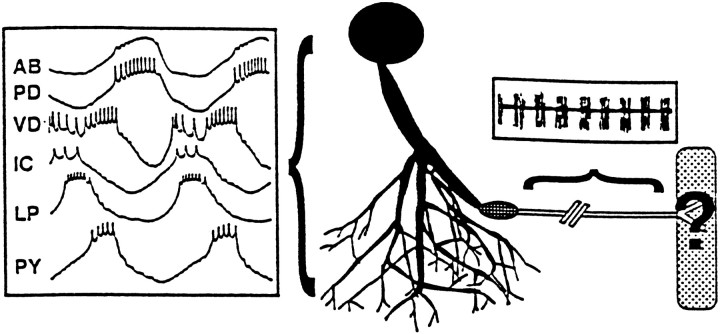
The patterned activity generated by the pyloric circuit in the stomatogastric ganglion of the spiny lobster, Panulirus interruptus, results not only from the synaptic connectivity between the 14 component neurons but also from differences in the intrinsic properties of the neurons. Presumably, differences in the complement and distribution of expressed ion channels endow these neurons with many of their distinct attributes. Each pyloric cell type possesses a unique, modulatable transient potassium current, or A-current (I(A)), that is instrumental in determining the output of the network. Two genes encode A-channels in this system, shaker and shal. We examined the hypothesis that cell-specific differences in shaker and shal channel distribution contribute to diversity among pyloric neurons. We found a stereotypic distribution of channels in the cells, such that each channel type could contribute to different aspects of the firing properties of a cell. Shal is predominantly found in the somatodendritic compartment in which it influences oscillatory behavior and spike frequency. Shaker channels are exclusively localized to the membranes of the distal axonal compartments and most likely affect distal spike propagation. Neither channel is detectably inserted into the preaxonal or proximal portions of the axonal membrane. Both channel types are targeted to synaptic contacts at the neuromuscular junction. We conclude that the differential targeting of shaker and shal to different compartments is conserved among all the pyloric neurons and that the channels most likely subserve different functions in the neuron.


Figures

Fig. 1.
Fig. 1.
Anti-Shal and anti-Shaker specifically recognize their respective proteins. Western blots containing protein extracts from the lobster nervous system (NS) and tail muscle (M) were probed with anti-Shal (A) or anti-Shaker (B) antibody. The molecular weight standards for each Western blot are indicated. Western blots containing in the 16.7 kDa pinpoint-Shaker (K) and the 15.2 kDa pinpoint-Shal (L) fusion proteins were probed with anti-Shal (C) and anti-Shaker (D) antibodies. The arrows point to the position of the 28 kDa GST protein.
Fig. 2.
Fig. 2.
Staining in the peripheral layer of the STG.A, Diagrammatic representation of a midsagittal section through the STG, with a single neuron highlighted. Note that, after branching in the neuropil, stomatogastric neurons send axons out the dvn or stn. B, Diagram of a horizontal section through the STG. C–F, Confocal optical sections from whole-mount STG preparations stained with anti-Shaker (C, E) or anti-Shal (D,F). C and Drepresent a series of optical sections through the peripheral zone of two representative STGs. The white regions indicate staining. All optical sections are in the horizontal plane (B) and are ∼6.3-μm-thick. The distance between the center of two adjacent slices varies from 8 to 20 μm. The same scale bar applies to C and D.E and F represent high-magnification optical sections through individual neurons in whole-mount preparations. The sections are ∼0.5 to 1-μm-thick. Thearrows in E define the thickness of the sheath. The arrows in F point to glial somata in the cap of a neighboring neuron.
Fig. 3.
Fig. 3.
Shal but not Shaker channels are found in the membranes of neuronal somata. Horizontal optical sections through two physically isolated neurons lacking glial caps. Neurons were stained with anti-Shal (A) or anti-Shaker (B) and with propidium iodide. Propidium iodide stained the nuclei red, whereas channel antibodies stained green. Slices are ∼1 μm thick.
Fig. 4.
Fig. 4.
The density of shal transcripts, Shal channels, and somatic IAs are all linearly correlated in pyloric neurons. A, Representative horizontal optical section from an anti-Shal-stained whole-mount STG preparation in which neurons were electrophysiologically identified before ICC. Two nonpyloric neurons were filled with 5,6-carboxyfluorescein to orient the ganglion to the map after the ICC protocol. Optical slices were ∼13.3-μm-thick.B, The mean protein immunofluorescence (circles) and the average number of Shal transcripts (squares) for each cell type were first normalized by membrane capacitance and then plotted against the average maximalIA density in that cell type.IA density is defined as the average corrected Gmax divided by membrane capacitance (Baro et al., 1997;Willms et al., 1999). All statistical analyses were performed after dividing the data by membrane capacitance. Error bars represent SEs. Lines represent linear regressions of all data points (transcript density) or all data points excluding the LP (staining density). The cell types and the number of cells in each cell type are as follows: PD, 2; VD, 1;PY, 8; AB, anterior burster, 1;IC, inferior cardiac, 1; LP, 1. The number of cells used to determine average staining intensity, transcript number, corrected maximal conductance, and membrane capacitance respectively, were as follows: PD, 15, 9, 5, 10; VD, 9, 8, 5, 5; PY, 22, 14, 7, 10;AB, 4, 4, 5, 3; IC, 6, 6, 5, 3;LP, 6, 6, 7, 7. The data on transcript number, corrected maximal conductance, and membrane capacitance were taken from Baro et al. (1997). Significantly different (p < 0.05) than *PD, **LP, ***PY, ****VD, *****IC, and ******AB, as judged by two-tailed t tests.
Fig. 5.
Fig. 5.
Shal, but not Shaker, channels mediate theIA in the neuropil. Shown are horizontal optical sections from various STG whole-mount preparations stained with anti-Shal (A–F) and anti-Shaker (G), or an anti-Shaker-stained cross-section of the STG (H). A, An optical section from the center of the ganglion showing the peripheral zone (somata) encircling the layer of fine neuropil, which surrounds the coarse neuropil. Note that large processes are outlined in the central coarse neuropil and that tufts of fine neuropil along the periphery are intensely stained. The thickness of the slice is ∼13.3 μm.B, Higher magnification of the coarse neuropil showing a primary neurite with intense cytoplasmic staining, and higher order neurites with variations in the staining of the cytoplasm and the membrane. The slice thickness is ∼6.3 μm. C, High magnification of a neurite from the coarse neuropil;arrowheads point to presumptive glial somata or blood vessels adjacent to the neurite. The thickness of the slice is ∼1 μm. D, Projection of six optical sections, spanning ∼6–8 μm in depth, showing the variation in membrane staining intensity in neighboring neurites. Also note the lack of glial staining between neurites and the lack of glial somata. E, Optical cross-sectional view through the neuropil of a ganglion. Tracts of glia and large neurites separate the fine neuropil. Note that the anti-Shal stain encircles small fibers in the V-shaped regions of synaptic neuropil. Larger processes separating the fine neuropil are also outlined and some show cytoplasmic staining. The slice is ∼6.3-μm-thick. F, High magnification of the fine neuropil; note the amorphous mesh-like structure of this anti-Shal stained region. The section is 1–2 μm in depth.G, Optical section from the center of a whole-mount anti-Shaker-stained ganglion. Note the complete absence of staining in the neuropil. The thickness of the section is ∼13.3 μm.H, Cross-section from an anti-Shaker-stained ganglion. The thickness of the optical section is 6–8 μm. Note that the most intensely stained structure is the perineural sheath along the sides and bottom of the ganglion.
Fig. 6.
Fig. 6.
Anti-Shaker is found in axonal compartments located in the nerves of the STNS. A, Diagram of the STNS. Lines represent nerves,filled ovals represent ganglia, andrectangles represent muscles. COG, Commissural ganglion; EOG, esophogeal ganglion;ion, inferior esophogeal nerve; son, superior esophogeal nerve; lpn, lateral pyloric nerve;pyn, pyloric constrictor nerve; IC, inferior cardiac. B, Electron micrograph of STNS axon with surrounding glial sheath; we gratefully acknowledge that the EM photograph was a kind gift from Dr. David King. gn, Glial cell nucleus. Line with double arrowheads shows the thickness of the glial wrap at one point tangential to the axon.C, Horizontal optical section (13.3-μm-thick) from the center of a representative anti-Shaker-stained ganglion–dvn showing the emergence of the dvn from the STG. Arrowsapproximate the preaxon region (between the end of the neuropil and the beginning of the dvn). Note that the lack of anti-Shaker staining in the neuropil processes continues as the processes leave the ganglion and enter the dvn, whereas the perineural sheath (PS) is brightly stained. D, Horizontal optical section from the distal region of an anti-Shaker-stained dvn. Note the continuous stain along the edges of large axons in the plane of focus and the fainter staining in the surrounding glial sheaths when they are in the plane of focus. The faintly stained bundle of small-diameter axons is seen just below center. The optical section is ∼6 to 8-μm-thick.E, High magnification of a single process and the surrounding glial sheath from an anti-Shaker-stained lvn.Arrows mark the outer bounds of the glial sheath. The thickness of the optical section is ∼0.5 μm.F, Anti-Shaker stained PD nerve, which contains only the axons from the two PD neurons, approaching the PD muscle. The section is ∼6 to 8-μm-thick.
Fig. 7.
Fig. 7.
Immediately after branching in the neuropil, Shal channel density is dramatically reduced in most STG processes.A–C, Three representative ganglia and dvns stained with anti-Shal. Arrows approximate the preaxon region of the STG, and arrowhead points to the bipolar anterior gastric receptor cell located in the dvn. PS, Perineural sheath. A, Projection of six optical slices through the posterior portion of the STG and the beginning of the dvn. The projection represents ∼45 μm in depth. Note the lack of staining outside of the neuropil. A few (pre-) axons were outlined in most ganglia (n = 10 STG), but for the most part, staining of the processes outside the neuropil was only slightly above background. B, C, Single optical sections from representative anti-Shal-stained ganglia and dvns. Sections are ∼13.3-μm-thick. D, Horizontal optical section from the distal portion of an anti-Shal-stained dvn. Note the heterogeneous staining of the axoplasm. Background levels of staining are varying from A to D, and so thepanels cannot be directly compared. The thickness of the section is ∼6 μm. E, High magnification of an axon from an anti-Shal-stained lvn. Note that anti-Shal does not outline the axon. The section thickness is ∼1 μm. F, Optical section from an anti-Shal-stained pdn showing a region in which the two PD axons are differentially stained with anti-Shal.Arrows point to the autofluorescent disk-shaped structures that were present throughout the entire pdn. The section is ∼1 to 2-μm-thick.
Fig. 8.
Fig. 8.
Shal and Shaker channels are targeted to the PD NMJ. A single optical section from an innervated PD muscle double-labeled with a mouse monoclonal antibody against acetylcholinesterase (antiACh; A) and our polyclonal anti-shaker (B). Secondary antibodies were tagged with Oregon Green (anti-mouse) or Texas Red (anti-rabbit). Both fluorescent tags were concurrently imaged in all optical slices of a z-series through the NMJ. Optical section from a second PD muscle double-labeled with anti-AcH(C) and anti-shal(D). Imaging was as described for the previouspanels. Optical sections are ∼0.5 to 2-μm-thick.
Fig. 9.
Fig. 9.
The functional implications of the differential compartmentalization of Shaker and Shal channels along a pyloric neuron. The diagram represents the PD neuron innervating the PD muscle. The shaded areas represent the regions of the neuron that contain membrane-bound Shal channels but no membrane-bound Shaker channels. The area corresponds exactly to the somatodendritic compartment, which lies in the peripheral layer and neuropil of the STG. The box positioned next to the neurites contains spontaneous, simultaneous intracellular recordings from the somata of each of the six identified pyloric cell types (Miller, 1987). Shal, but not Shaker, channels contribute to the large, rhythmic oscillations in membrane potential that are generated in, and influenced by, the somatodendritic compartment. The circle with the grid represents the region in which membrane-bound Shaker and Shal channels are not detectable. This region most likely contains the initial segment molecular fence that prevents diffusion of membrane proteins (Winckler and Mellman 1999; Winckler et al., 1999). The primary spike initiation zone might lie in, or immediately proximal to, this region, suggesting that somatodendritic Shal channels primarily mediate the effect of the IA on spike timing and frequency. The unshaded area represents the region in which membrane-bound Shaker channels predominate. This region corresponds to the distal axonal compartment located in stomatogastric nerves. A typical extracellular recording from this compartment is shown above the axon. Shaker channels most likely contribute to spikes that are not propagated on a depolarizing wave but on a flat hyperpolarized membrane potential (Marder and Selverston, 1992). The stippled box represents the muscle. Thequestion mark signifies that Shaker and Shal are both present at the NMJ, but their locations in the component membranes are not known.

References

    1. Alonso G, Widmer H. Clustering of KV4.2 potassium channels in postsynaptic membrane of rat supraoptic neurons: an ultrastructural study. Neuroscience. 1997;77:617–621. - PubMed
    1. Atwood HL, Govind CK, Jahromi SS. Excitatory synapses of blue crab gastric mill muscles. Cell Tissue Res. 1977;177:145–158. - PubMed
    1. Atwood HL, Govind CK, Kwan I. Nonhomogeneous excitatory synapses of a crab stomach muscle. J Neurobiol. 1978;9:17–28. - PubMed
    1. Ayali A, Harris-Warrick RM. Monoamine control of the pacemaker kernel and cycle frequency in the lobster pyloric network. J Neurosci. 1999;19:6712–6722. - PMC - PubMed
    1. Baldwin DH, Graubard K. Distribution of fine neurites of stomatogastric neurons of the crab Cancer borealis: evidence for a structured neuropil. J Comp Neurol. 1995;356:355–367. - PubMed

Publication types

Substances

LinkOut - more resources