. 2000 Sep 1;20(17):6648-65.
doi: 10.1523/JNEUROSCI.20-17-06648.2000.

Neuronal and glial membrane potentials during sleep and paroxysmal oscillations in the neocortex

Affiliations

Neuronal and glial membrane potentials during sleep and paroxysmal oscillations in the neocortex

F Amzica et al. J Neurosci. .

Abstract

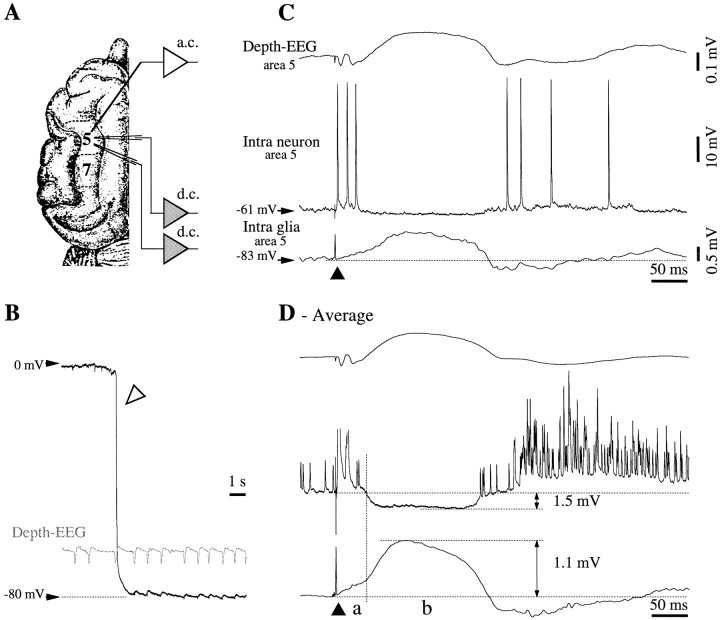
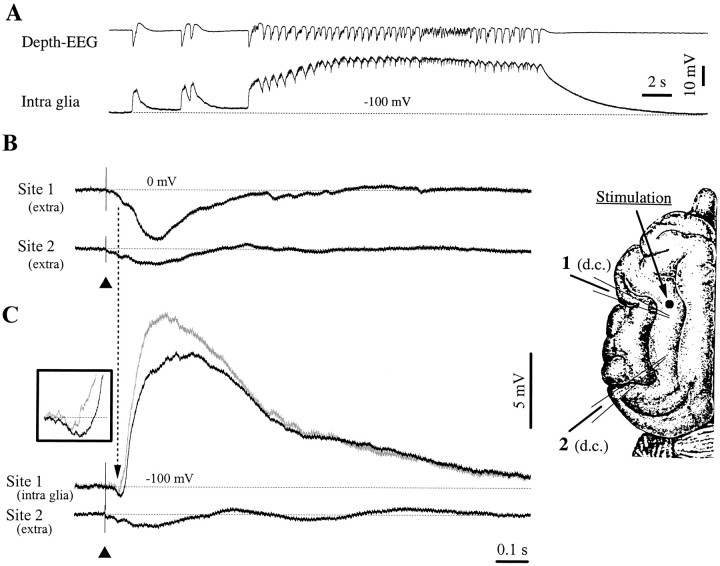
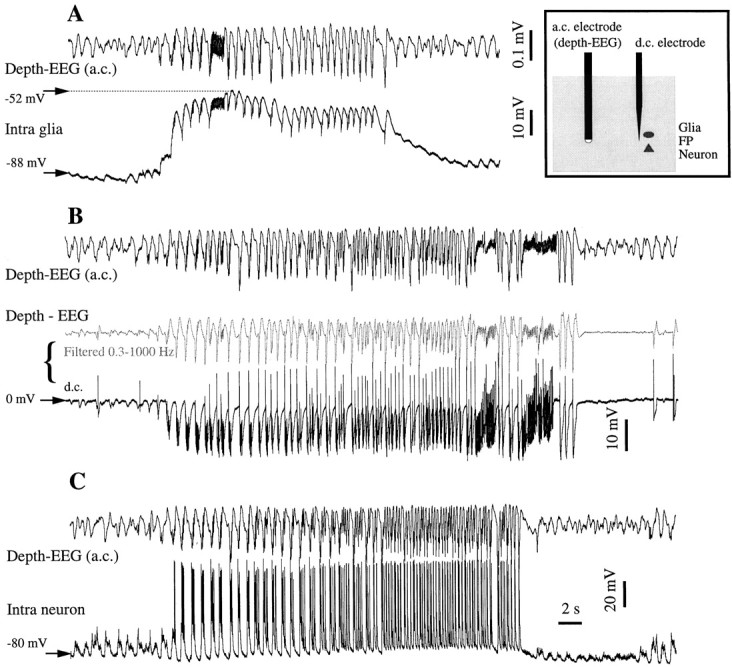
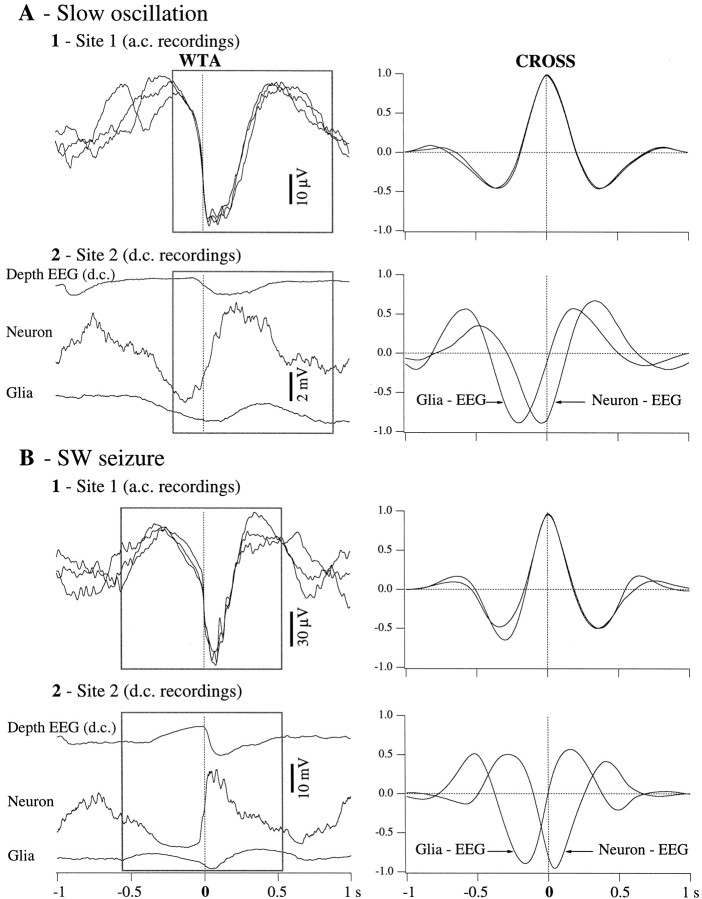
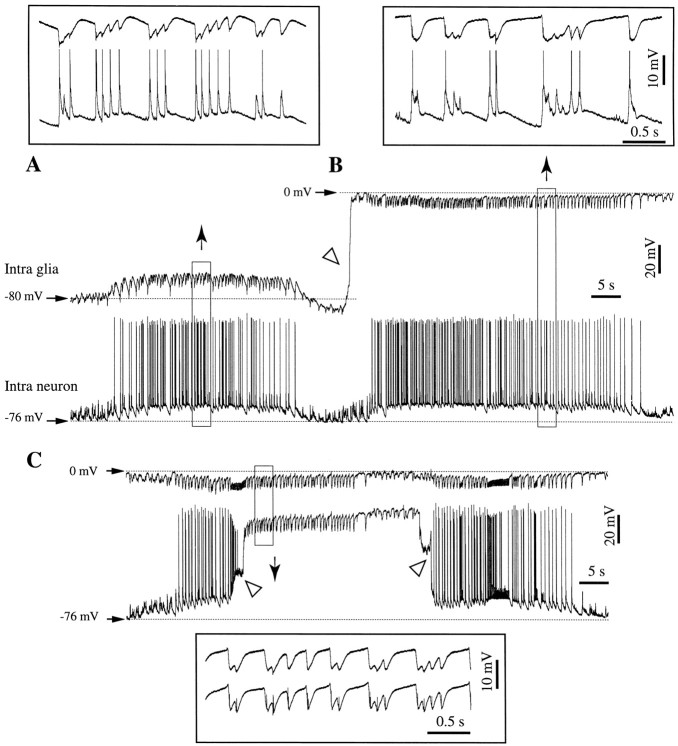
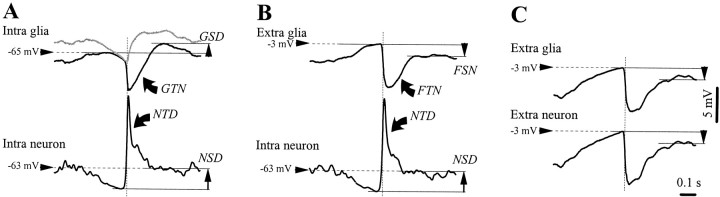
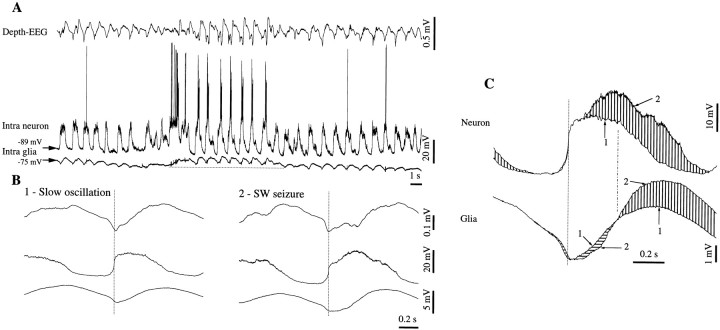
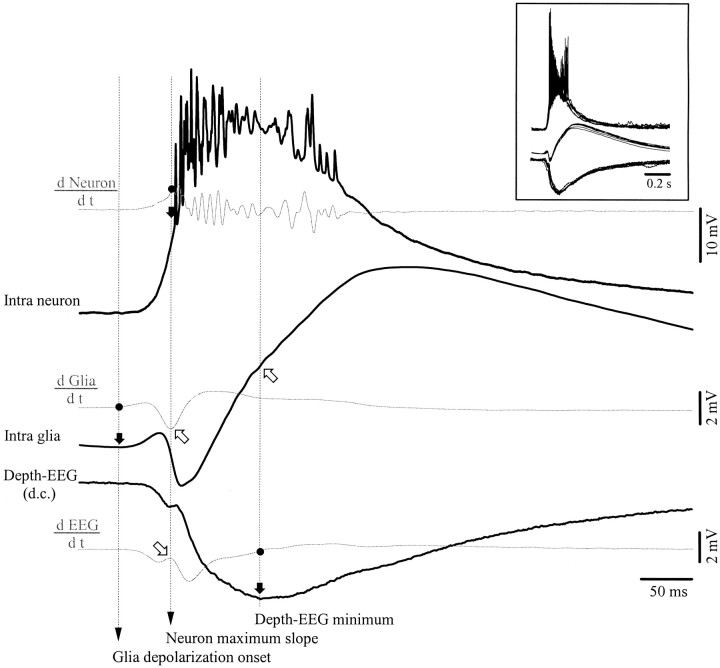
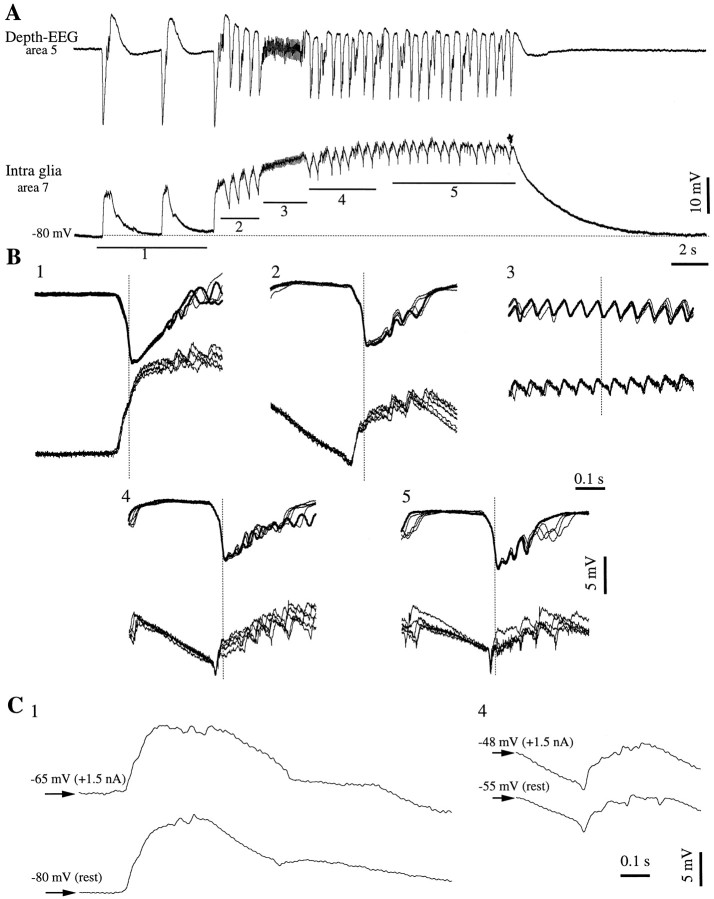
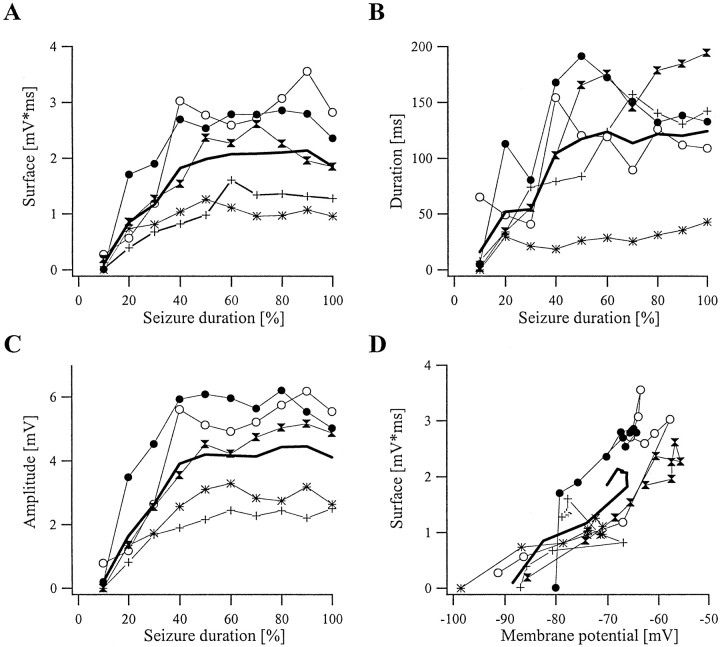
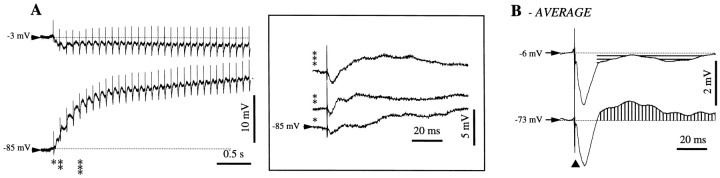
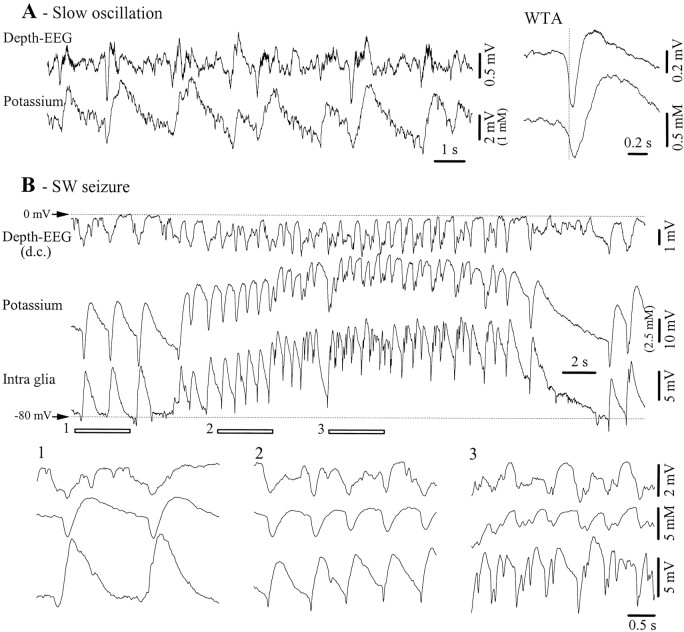
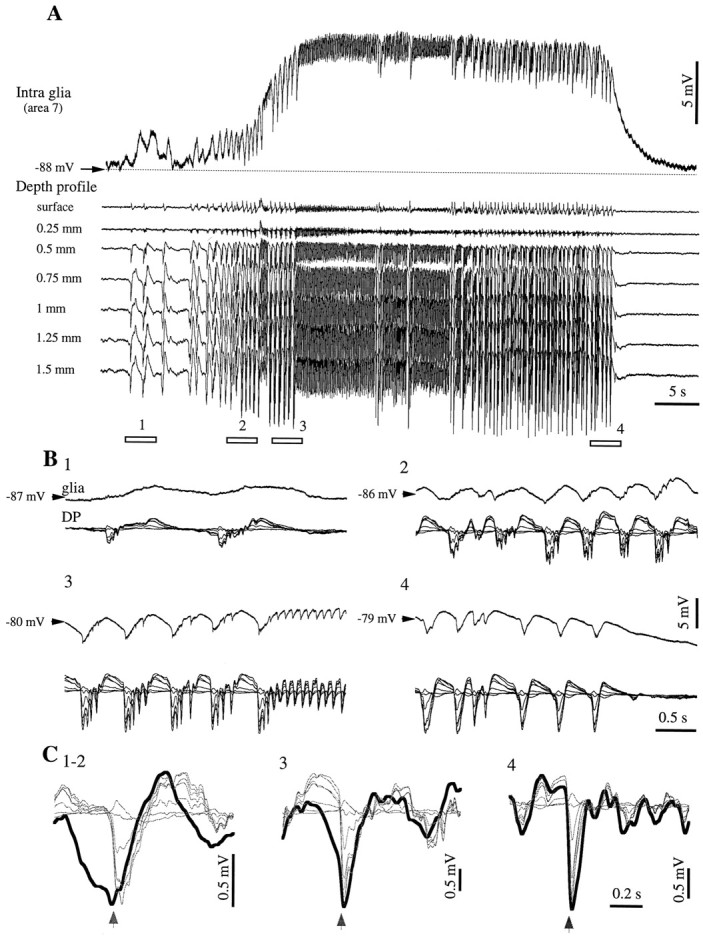
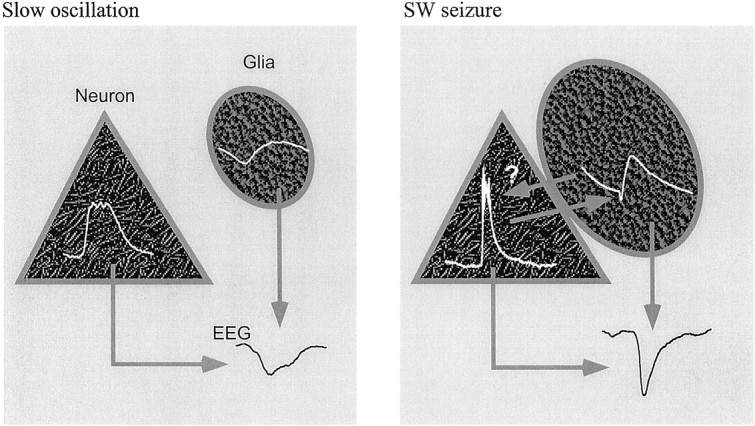
This study investigated the fluctuations in the membrane potential of cortical neurons and glial cells during the slow sleep oscillation and spike-wave (SW) seizures. We performed dual neuron-glia intracellular recordings together with multisite field potential recordings from cortical suprasylvian association areas 5 and 7 of cats under ketamine-xylazine anesthesia. Electrical stimuli applied to the cortex elicited responses consisting of a biphasic depolarization in glial cells, which was associated with an EPSP-IPSP sequence in neurons. During the slow (<1 Hz) oscillation, extracellular measurements of the potassium concentration revealed periodic increases with an amplitude of 1-2 mm, similar in shape to glial activities. We suggest that, through their uptake mechanisms, glia cells modulate the neuronal excitability and contribute to the pacing of the slow oscillation. The slow oscillation often evolved into SW paroxysms, mimicking sleep-triggered seizures. This transition was associated with increased coupling between the depolarizing events in neurons and glial cells. During seizures, the glial membrane potential displayed phasic negative events related to the onset of the paroxysmal depolarizing shifts in neurons. These events were not voltage dependent and increased their incidence and amplitude with the development of the seizure. It is suggested that the intraglial transient negativities represent field reflections of synchronized neuronal potentials. We propose that the mechanisms underlying the neuron-glia communication include, besides the traditional neurotransmitter- and ion-mediated pathways, field effects crossing their membranes as a function of the state of the cortical network.


Figures

Fig. 1.
Fig. 1.
Normal responsiveness of cortical neurons and glia to cortical stimulation. A, Top view of cat's brain with the localization of association areas 5 and 7 in the suprasylvian gyrus. B, The impalement of a glial cell is marked (open arrowhead) by a sudden voltage deflection from extracellular potential values (∼0 mV) to −80 mV. Intraglial potentials (slow depolarizations) are reversed with respect to the extracellular ones. C, Double intracellular (neuron–glia) and field potential recording in cortical area 5. Response to a single cortical shock (black triangle) delivered close to the field electrode. The recording sites correspond to those indicated in A. The neuronal response consisted of an initial depolarization crowned by action potentials, an inhibitory potential, and a rebound excitation. The corresponding responses in the glia were a sluggish depolarizing slope, a slow further depolarization, and a negative wave, respectively. This shape was reproduced in the depth-EEG recording, with the exception of the early response, which appeared as a negative potential.D, Average of 25 responses evoked by the cortical stimulation. The initial glial depolarization (a) is clearly separated from the following positive wave (b) by a change of the depolarizing slope. In this and the following figures, all potentials are presented with the positivity upward. Intracellular recordings are all at rest (zero current), unless expressly indicated, and the resting membrane potential is indicated at left.
Fig. 2.
Fig. 2.
Glial responsiveness to cortical stimulation in a seizure-prone cortex. A, One of the SW seizures recurring periodically in this cat. The seizures started with isolated PDSs (left) and continued with periodic SW complexes at 2–4 Hz. Two d.c. recording pipettes (1 and2) and a stimulating electrode were placed in the depth of the suprasylvian gyrus, according to the brain scheme on theright. The intraglial recording during the seizure was recorded with pipette 1, whereas the depth-EEG activity was recorded with a macroelectrode placed close to the pipette. All recordings in B and C display averaged (n = 25) responses. The black arrowhead indicates the stimulation artifact. B, Both pipettes record extracellular activities. Note the higher amplitude response closer to the stimulation site. C, Responses at the same location, after impaling a glial cell at site1 (resting Vm at −100 mV) just below (2 μm) the recording shown in B. The glial response consists of an initial negative deflection, followed by a huge, round, positive wave. The vertical dotted linepoints to the simultaneous occurrence of a field negativity in both extracellular (B) and intraglial (C) recordings. The trace ingray represents the difference between the intracellular response and the field response at site1. The inset displays the expanded negativity of the glial response, before and after correction.
Fig. 3.
Fig. 3.
SW seizures recorded successively in various couple configurations. We kept one a.c. EEG electrode at a fixed depth, while penetrating with a pipette and recording first a glia (A), then d.c. extracellular field potentials (B), then a neuron (C). All seizures evolved from sleep-like, slowly oscillating patterns and produced recursive spike-and-wave complexes at 1.5–3 Hz. The seizure in the glia and neuron recordings is associated with a steady depolarization, which corresponds to a steady hyperpolarization in the d.c. extracellular recording. The vertical distance between the glia and the neuron is <10 μm, whereas the horizontal distance between the two electrodes is ∼0.5 mm. The EEG voltage calibration bar inA and the time calibration bar in C are common for all panels. In B, the depth-EEG recorded with the d.c. electrode (in black) was digitally filtered off-line between 0.3 and 1000 Hz (middle trace ingray) to emphasize that both d.c. and a.c. electrodes illustrate the same activity.
Fig. 4.
Fig. 4.
WTAs and correlative analyses for the activities presented in Figure 3. WTAs were triggered with the sharpest negative slope of the K-complex (A) and of the EEG spike (B) in the a.c. trace (Site 1, left panels). The triggering point is indicated by thevertical dotted lines. Two situations were analyzed: slow-wave sleep activities (A) and SW seizures (B). The three traces displayed in each left panel correspond to one of the three recording configurations described in the previous figure. The WTA traces recorded at Site 1 were superimposed to reveal a 1 sec epoch (in the square) in which their superimposition was optimal (see cross-correlations at right with correlative peaks >95%). The same 1 sec epoch was then used to calculate cross-correlations between the respective traces recorded atSite 2. These cross-correlations show roughly that during both slow oscillations and SW seizures, extracellular potentials reflect reverted intraglial and/or intraneuronal potentials. They also disclose time relationships between intracellular and extracellular potentials within cells separated by <10 μm.
Fig. 5.
Fig. 5.
Neuron–glia interaction during SW seizures. Continuous recording containing a double neuron–glia impalement (A), a neuron-field recording (B), and a double field d.c. recording (C) in cortical association area 7. The two electrodes are separated by <1 mm. The transition fromA to B is marked by the withdrawal of the pipette from the glia (oblique open arrowhead). During the neuron field recording (C), the second pipette is also withdrawn from the neuron (oblique open arrowhead at left), and a few seconds later it impales again, presumably the same neuron (oblique open arrowhead at right). Epochs within the squares are expanded above (A and B) or below (C) the respective panels. Note the recurrent sharp negative intraglial deflections associated with sharp neuronal depolarizing potentials (A).
Fig. 6.
Fig. 6.
WTAs (n = 40) for the activities displayed in Figure 5. WTAs were triggered with the steepest slope at the onset of a SW complex as recorded with the second pipette (neuron pipette in the A and B and extracellular field recordings in C).A, Dual neuron–glia impalement. Two components were evident in the neuron: a transient depolarization (NTD) followed by a steady depolarization (NSD). The corresponding potentials in the glial recording were a transient negativity (GTN) and a steady depolarization (GSD). The gray trace resulted from the subtraction of the extraglial WTA (B) from the intraglial WTA (A). B, Recording with the first electrode withdrawn from the glia and the second electrode in the same neuron as in A. The same components were present in the neuronal SW complex. The NTD was associated in the extracellular field with a transient negative deflection (FTN), similar, to, although broader than, theGTN. The NSD corresponded to a steady negative potential (FSN).C, With both pipettes withdrawn from the respective cells, the WTAs at the two locations were identical. The calibration bar is the same for all panels.
Fig. 7.
Fig. 7.
Glial transient negative potentials appear mostly during epileptiform activities. Double intracellular recording (neuron–glia) in association with area 5. A, Short SW seizure evolving from a slow oscillation pattern. The epileptic episode is accompanied in the glia recording by a persistent depolarization (above the horizontal dotted line). B, WTAs from the slow oscillation (1) and from the SW seizure (2) triggered with the steepest positive slope of the neuron (vertical dotted line). Note the additional depolarizing peak over the depolarization of the neuron in B2 and the corresponding negative potential superimposed on the glial potential. C, Superimposition of the neuronal and glial WTAs, from A andB, respectively. Traces marked with 1 are from the slow oscillation WTA; those with marked with 2are from the SW seizure. Vertical lines point to the excess of depolarization, and horizontal lines mark hyperpolarization during the seizure as compared with the slow oscillation activity.
Fig. 8.
Fig. 8.
Evidence that the glial transient negativities reflect neuronal depolarizations. Shown are simultaneous intracellular recordings of neuronal and glial activities, together with d.c. extracellular field potentials. Black traces represent WTAs (n = 50) of rhythmic PDSs. The threegray traces are derivatives (d/dt) of the respective potentials. Several points (black dots) were marked on the three derivatives: the onset of the glial depolarization at the point where its derivative becomes positive, the maximum of the neuronal derivative coinciding with the maximum slope of the neuronal depolarization, and the minimum of the depth-EEG at the moment where the field derivative is zero. A black arrow and avertical dotted line mark the correspondence of these points with the associated potential in each trace. Open arrows point toward the coincidence with particular shapes: the maximum slope at the onset of the neuronal depolarization coincides with the maximum negative slope at the onset of the corresponding glial negativity (top arrow) and with a dicrotic swing in the EEG (bottom arrow). The EEG minimum is associated with the change in slope of the glial depolarization. Also note that the glial depolarization starts before the neuronal depolarization.
Fig. 9.
Fig. 9.
Glial transient negative potentials are modulated by the evolution of the seizure and are not voltage dependent.A, Intraglial and field potential (a.c.) recording during a seizure starting with isolated PDSs (1) and continuing with recurrent SW complexes (2,4, 5) and fast runs (3). B, In each panel, superimposition of five sweeps extracted around the point of maximum negative slope of the field potential (dotted vertical line). The five panels correspond to the underlined epochs in A. Three of the sweeps in panel 1 were taken from a previous seizure recorded in the same glia. Note the absence of negative potentials in B1 and their progressive appearance from B2 to B5. C, Superimposition of two interictal (1) and two ictal (4) PDSs recorded without current (at rest) and when injecting +1.5 nA steady current into the glial cell. The sweeps belong to successive seizures and to periods similar to the ones indicated in A. Regardless of the amount of current injected and of the imposed membrane potential, there were no negative transient potentials at the beginning of the seizure (C1), and they had similar evolutions during seizures.
Fig. 10.
Fig. 10.
Dynamic evolution of the parameters of the glial negativity as a function of the seizure development. Each panel contains the results from five seizures and their average. Seizures, regardless of their duration, were divided into 10 equal windows. The surface area of glial negativities at the beginning of a SW complex (A), their duration (B), and their amplitude (C) were calculated for all SW complexes contained in each window and averaged. This average is plotted against the respective window ordinal, expressed as a percentage of the total time of the seizure. Therefore the abscissae inA–C represent the percentage of the total duration of the seizure. Each panel also contains the grand average for the five seizures depicted (thick line). D, The surface area of the glial negativities plotted against the membrane potential at which they occurred shows nonlinear dependence, suggesting that they are not a voltage-dependent phenomenon.
Fig. 11.
Fig. 11.
Evolution of glial transient negative potentials evoked by cortical stimulation during SW seizures. A, SW seizure induced by cortical stimulation close to the recording site (area 5) of a glia and d.c. field potentials (left) and expansion of three sweeps (marked with asterisks) to show the evolution of the intracellular negativity as a function of the progression of the seizure (right). B, Evoked potentials (n = 50). Stimuli were delivered at 10 Hz and continued beyond the period depicted atleft. The glial evoked response displays an initial transient negative potential followed by a steady depolarization. The transient negativity was practically identical to that recorded in the d.c. field potential, whereas the depolarization appeared reversed in the depth-EEG.
Fig. 12.
Fig. 12.
Potassium activities related to the slow oscillations and SW seizures. A, Depth-EEG and K+ variations during a period with slow (<1 Hz) oscillations. The right panel depicts WTAs (n = 40) from the two leads. The WTAs were triggered with the steepest descending slope of the field potential (vertical dotted line). B, SW seizure recorded with a double-barrel pipette (Depth-EEG andPotassium) and with an intracellular microelectrode (Intra glia). In this panel, field potentials were not subtracted from the K+-sensitive or intraglial potentials because field and glial activities were time-lagged and because negative K+ potentials were more ample than their field equivalents. The three underlined epochs are expanded below and display two interictal PDSs (1), ictal PDSs during the initial part (2), and the middle of the seizure (3).
Fig. 13.
Fig. 13.
Relationship of intraglial potentials with the depth profile of SW seizures. A, Intraglial recording together with field potentials recorded at seven equidistant depths of the cortex. The distance between the pipette and the multiple electrodes was ∼1 mm, and the glia was recorded at a depth of ∼1.5 mm. The seizure starts with a few isolated PDSs and continues with rhythmic PDSs interrupted by sequences of fast runs. The four underlined periods are expanded in B. Small negative intraglial potentials appear toward the end of panel 2. C, WTAs triggered with the most negative slope at the onset of the EEG spike in the deepest lead. Averages were made with 10 sweeps taken within the beginning of the seizure (12), the middle of the seizure (3; with the exclusion of the fast runs), and the end of the seizure (4). The arrows belowindicate the triggering moment of the WTA. The glial WTA is drawn with a thick line. Note the increasing resemblance between intraglial and depth field potentials and the reversal of the latter in the surface of the cortex.
Fig. 14.
Fig. 14.
Schematic diagram of the mechanisms generating field potentials during slow oscillations (left) and SW seizures (right). An averaged cycle is drawn in each cell (white traces). During the slow oscillation, reversed neuronal and glial potentials contribute to the genesis of the extracellular field potential (EEG). SW seizures are accompanied by glial swelling, which may bring patches of cellular membranes into contact, allowing intraneuronal potentials to appear reversed, as field potentials, in the glial cells (arrowfrom neuron to glia points toward the glial negativity). The reverse pathway might also be at work (arrow from glia to neuron). Both intraneuronal and intraglial activities contribute to the shape of the extracellular field potential.

References

    1. Achermann P, Borbély AA. Low-frequency (<1 Hz) oscillations in the human sleep EEG. Neuroscience. 1997;81:213–222. - PubMed
    1. Ammann D. Ion selective microelectrodes. Springer; Berlin: 1986.
    1. Amzica F, Neckelmann D. Membrane capacitance of cortical neurons and glia during sleep oscillations and spike-wave seizures. J Neurophysiol. 1999;82:2731–2746. - PubMed
    1. Amzica F, Steriade M. Short- and long-range neuronal synchronization of the slow (<1 Hz) cortical oscillation. J Neurophysiol. 1995;75:20–38. - PubMed
    1. Amzica F, Steriade M. The K-complex: Its slow (<1 Hz) rhythmicity and relation to delta waves. Neurology. 1997;49:952–959. - PubMed

Publication types