. 2000 Sep;66(9):4058-67.
doi: 10.1128/AEM.66.9.4058-4067.2000.

Flexible community structure correlates with stable community function in methanogenic bioreactor communities perturbed by glucose

Affiliations

Flexible community structure correlates with stable community function in methanogenic bioreactor communities perturbed by glucose

A S Fernandez et al. Appl Environ Microbiol. 2000 Sep.

Abstract

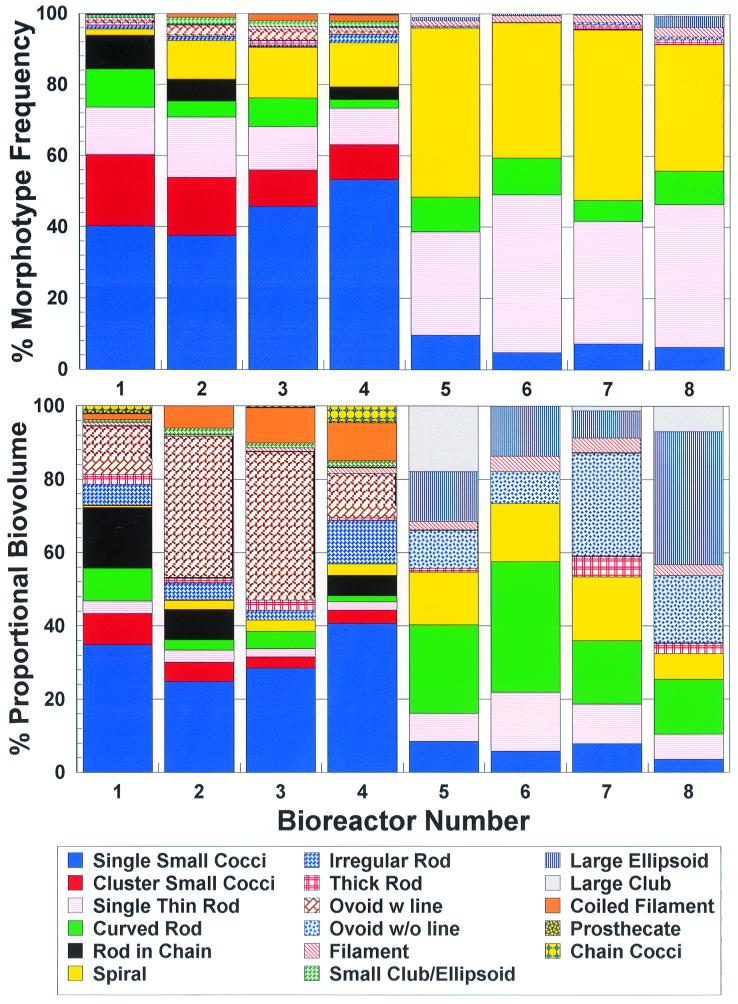
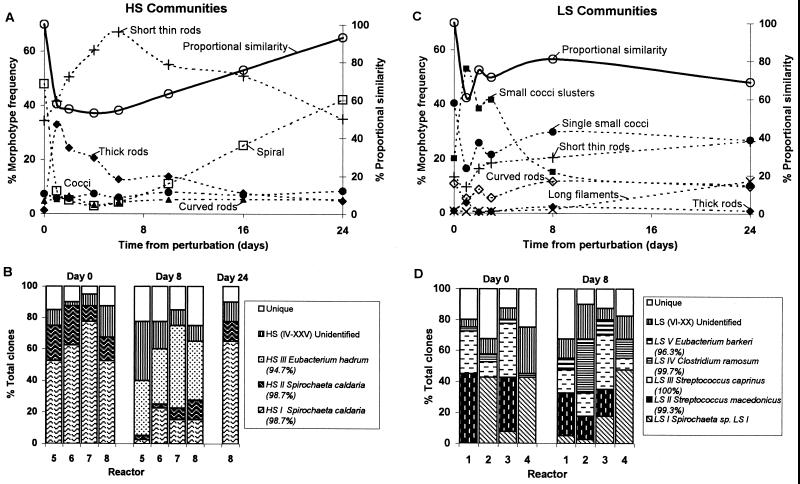
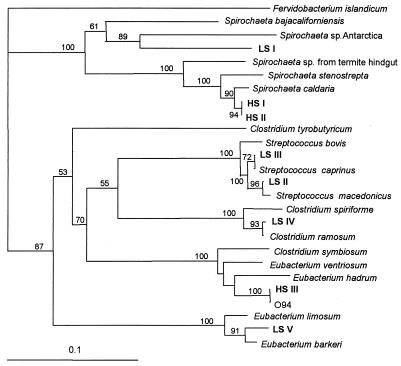
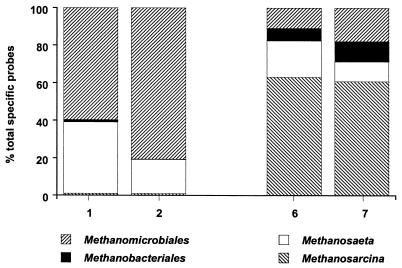
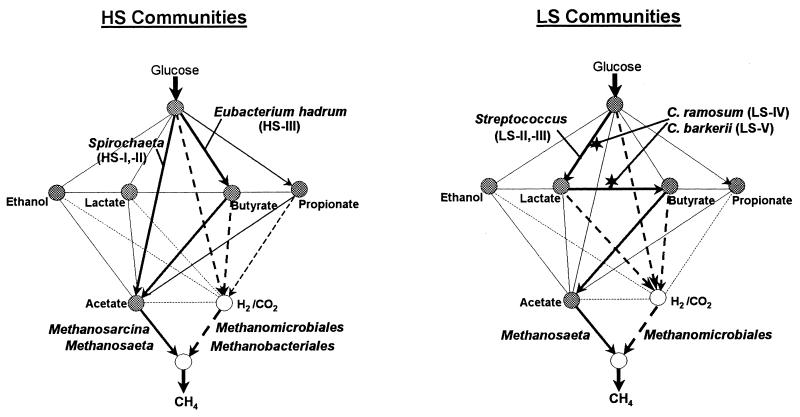
Methanogenic bioreactor communities were used as model ecosystems to evaluate the relationship between functional stability and community structure. Replicated methanogenic bioreactor communities with two different community structures were established. The effect of a substrate loading shock on population dynamics in each microbial community was examined by using morphological analysis, small-subunit (SSU) rRNA oligonucleotide probes, amplified ribosomal DNA (rDNA) restriction analysis (ARDRA), and partial sequencing of SSU rDNA clones. One set of replicated communities, designated the high-spirochete (HS) set, was characterized by good replicability, a high proportion of spiral and short thin rod morphotypes, a dominance of spirochete-related SSU rDNA genes, and a high percentage of Methanosarcina-related SSU rRNA. The second set of communities, designated the low-spirochete (LS) set, was characterized by incomplete replicability, higher morphotype diversity dominated by cocci, a predominance of Streptococcus-related and deeply branching Spirochaetales-related SSU rDNA genes, and a high percentage of Methanosaeta-related SSU rRNA. In the HS communities, glucose perturbation caused a dramatic shift in the relative abundance of fermentative bacteria, with temporary displacement of spirochete-related ribotypes by Eubacterium-related ribotypes, followed by a return to the preperturbation community structure. The LS communities were less perturbed, with Streptococcus-related organisms remaining prevalent after the glucose shock, although changes in the relative abundance of minor members were detected by morphotype analysis. A companion paper demonstrates that the more stable LS communities were less functionally stable than the HS communities (S. A. Hashsham, A. S. Fernandez, S. L. Dollhopf, F. B. Dazzo, R. F. Hickey, J. M. Tiedje, and C. S. Criddle, Appl. Environ. Microbiol. 66:4050-4057, 2000).


Figures

FIG. 1
FIG. 1
Replication of preperturbation community structure in the eight bioreactors: community morphotype frequency and proportional biovolume calculated by computer-assisted microscopy and image analysis. Some of the single thin rods exhibited autofluorescence emission at 420 nm. The LS reactors were reactors 1 through 4, and the HS reactors were reactors 5 through 8.
FIG. 2
FIG. 2
Micrographs of community samples from the HS reactor set. (A) Phase-contrast micrograph showing various distinct morphotypes, including spirals, short straight rods, curved rods, thin filaments, thick rods, single cocci, and an aggregate of pseudosarcina units. (B and C) Phase-contrast micrograph (B) and epifluorescence micrograph (C) of the same field of view, indicating that the aggregated pseudosarcina units and single short straight rods exhibit F420 autofluorescence. Bars = 10 μm.
FIG. 3
FIG. 3
Responses of the HS (A and B) and LS (C and D) communities to the glucose perturbation. (A and C) Morphotype frequency and proportional community similarity in reactor 7 (A) and reactor 1 (C). (B and D) ARDRA of the reactor communities 0, 8, and 24 days after the perturbation. Only reactor 8 was analyzed on day 24. Unique OTUs were defined as those that occurred once in each clone library (e.g., they were observed only once throughout the entire study in each reactor set). Species names indicate the most closely related known organisms. Percent similarities are indicated in parentheses.
FIG. 4
FIG. 4
Phylogram of the dominant SSU rDNA clones from the HS and LS communities created from analysis of 330 nucleotides of the 16S rRNA gene corresponding to positions 121 to 451 of Escherichia coli. Bootstrap values from 100 replicates are shown for each node. Values less than 50 are not shown. The scale bar represents a 10% estimated difference in nucleotide sequence. Clones obtained from the reactors are in boldface. The EMBL accession number for the Spirochaeta sp. from termite hindgut is X89048.
FIG. 5
FIG. 5
Relative abundances of methanogen-related SSU rRNA in LS reactors 1 and 2 and HS reactors 6 and 7 on day 0 determined by SSU rRNA membrane hybridization to oligonucleotide probes. The abundance of each group is expressed as a percentage of the total amount of methanogen-related SSU rRNA detected by all of the methanogen-specific probes used.
FIG. 6
FIG. 6
Network model of community structure and function in the HS and LS bioreactors during the glucose perturbation. The dotted lines and open circles indicate gas products. The thickness of each line represents the relative contribution of the pathway. The stars indicate in situ activities whose assignments to specific organisms are highly questionable due to the metabolic diversity of the most similar cultured organisms.

References

    1. Amann R I, Binder B J, Olson R J, Chrisholm S W, Devereux R, Stahl D A. Combination of SSU rRNA-targeted oligonucleotide probes with flow cytometry for analyzing mixed microbial populations. Appl Environ Microbiol. 1990;56:1919–1925. - PMC - PubMed
    1. Brauman A, Keleke S, Malonga M, Miambi E, Ampe F. Microbiological and biochemical characterization of cassava retting, a traditional lactic acid fermentation for foo-foo (cassava flour) production. Appl Environ Microbiol. 1996;62:2854–2858. - PMC - PubMed
    1. Canale-Parola E. Physiology and evolution of spirochetes. Bacteriol Rev. 1977;41:181–204. - PMC - PubMed
    1. Dazzo F B, Petersen M. Applications of computer-assisted image analysis for microscopical studies of the Rhizobium-legume symbiosis. Symbiosis. 1989;7:193–210.
    1. Felsenstein J. Confidence limits of phylogenies: an approach using the bootstrap. Evolution. 1985;39:783–791. - PubMed

Publication types

MeSH terms

LinkOut - more resources