. 2000 Sep 1;527 Pt 2(Pt 2):225-37.
doi: 10.1111/j.1469-7793.2000.00225.x.

Single-channel analysis of an NMDA receptor possessing a mutation in the region of the glutamate binding site

Affiliations

Single-channel analysis of an NMDA receptor possessing a mutation in the region of the glutamate binding site

L C Anson et al. J Physiol. .

Abstract

Recombinant NR1a/NR2A(T671A) N-methyl-D-aspartate (NMDA) receptor-channels, which carry a point mutation in the putative glutamate binding site that reduces glutamate potency by around 1000-fold, have been expressed in Xenopus laevis oocytes and their single-channel properties examined using patch-clamp recording techniques. Shut time distributions of channel activity were fitted with a mixture of five exponential components. The first three components in each distribution were considered to occur within a channel activation as they exhibited little or no dependence on agonist concentration. Bursts of single-channel openings were defined by a critical gap length with a mean of 5.65 +/- 0.37 ms. Shut intervals with a duration longer than this value were considered to occur between separate bursts of channel openings. Distributions of the lengths of bursts of openings were fitted with a mixture of four exponential components. The longest two components carried the majority of the charge transfer in the channel recordings and had means of 7.71 +/- 1.1 and 37.7 +/- 4.3 ms. The overall probability of a channel being open during a burst was high (mean 0.92 +/- 0.01). Brief concentration jumps (1 ms) of 10 mM glutamate were applied to outside-out patches so that a comparison between the macroscopic current relaxation and steady-state single-channel activity evoked by glutamate could be made. The decay of such macroscopic currents was fitted with a single exponential component with a mean of 32.0 +/- 3.53 ms. The good agreement between macroscopic current decay following brief agonist exposure and the value for the slowest component of the burst length distribution suggests that the bursts of openings that we identified in steady-state recordings represent individual activations of recombinant NR1a/NR2A(T671A) NMDA receptor-channels. A new way of displaying geometric distributions is suggested, and the utility of a modified definition of the 'probability of being open within a burst' is discussed. The single-channel data that we present in this paper support further the idea that the point mutation T671A in the NR2A NMDA receptor subunit affects mainly the ability of glutamate to remain bound to these channels.


Figures
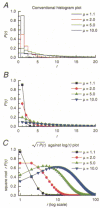
Figure 1
Figure 1. Illustration of a new type of display for geometric distributions
A, the conventional histogram display of four simple geometric distributions, with means of 1.1, 2.0, 5.0 and 10.0. B, the same distributions as depicted in A, but displayed as points rather than bins. C, a new type of display for data that are distributed geometrically. The value of r is plotted on a logarithmic scale on the abscissa and the square root of the product of r and the frequency with which r occurs is plotted on the ordinate. This results in a plot that has a peak of close to the mean of the distribution, as described in Methods.
Figure 5
Figure 5. Distributions of total open time per burst and number of open periods per burst for NR1a/NR2A(T671A) and wild-type NR1a/NR2A NMDA receptor-channels
A, distribution of total open time per burst (for data illustrated in Fig. 4A) fitted with a mixture of four exponential components. The fit predicts 1917 events while the distribution contains 1286. The overall mean of this distribution is 5.41 ms. The dashed line is the fit of the equivalent distribution for wild-type NR1a/NR2A bursts and has an overall mean of 12.5 ms (data from Wyllie et al. 1998). The values of the time constants (and their areas) for the wild-type NR1a/NR2A distribution are 63 μs (41 %), 1.60 ms (22 %), 14.7 ms (30 %) and 150 ms (7 %). B, distribution of number of open periods per burst for a typical recording of NR1a/NR2A(T671A) receptor-channel activity (same experiment as in A), and plotted in the new way, as √(rfr(r)) against log(r), where fr(r) is the observed frequency of bursts that appear to contain r open periods (see Methods). These observed values are shown as filled squares, and the corresponding fitted values are shown as open circles (these have been joined by straight lines for the sake of legibility). The observed frequencies have been averaged in groups of 5 above r = 26. This distribution is fitted with a mixture of three geometric components and has an overall mean of 3.10. C, distribution of number of open periods per burst obtained by pooling data from NR1a/NR2A(T671A) NMDA receptor-channel recordings. Again this distribution is fitted with a mixture of three geometric components with means and areas as indicated and has an overall mean of 3.19. The observed frequencies have been averaged in groups of 5 above r = 25. D, distribution of number of open periods per burst obtained by pooling data from wild-type NR1a/NR2A NMDA receptor-channel recordings fitted with a mixture of three geometric components. The overall mean of this distribution is 6.84. The observed frequencies have been averaged in groups of 5 above r = 22.
Figure 4
Figure 4. Burst length distribution and alignment of bursts for NR1a/NR2A(T671A) NMDA receptor-channels
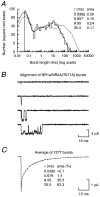
A, distribution of NR1a/NR2A(T671A) NMDA receptor-channel burst lengths from an experiment in which channels were activated by 100 μm glutamate (+ 20 μm glycine). The distribution is fitted with a mixture of four exponential components with means and areas as indicated (continuous line). The distribution contains 1286 bursts and the fit predicts 1929 events. The overall mean of this distribution is 6.08 ms. The dashed line is the fit of wild-type NR1a/NR2A activation lengths, and is taken from data published in Wyllie et al. (1998) (Fig. 3A). The fit is scaled to take account of the different number of events contained in each distribution and has an overall mean of 35.8 ms. The values of the time constants (and their areas) for the wild-type NR1a/NR2A distribution are 42 μs (39 %), 0.38 ms (8 %), 1.88 ms (8 %), 4.08 ms (14 %), 40.6 ms (17 %) and 201 ms (14 %). B, examples of four NR1a/NR2A(T671A) bursts taken from the same experiments as illustrated in A. These events are an attempt to represent the ‘average’ burst in each of the four components of the distribution. The upper trace in panel B has a duration of around 40 μs and as such does not reach its full amplitude due to the fact that the data have been filtered at 2 kHz. C, current trace obtained from the alignment and averaging of the 1286 bursts recorded in this experiment. The decay of this current is fitted with a sum of four exponential components (dashed line) with the time constants fixed to the values from the burst length distribution illustrated in A.
Figure 3
Figure 3. Shut time distributions for NR1a/NR2A(T671A) NMDA receptor-channels activated by different concentrations of glutamate
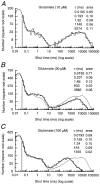
A, shut time distribution for NR1a/NR2A(T671A) NMDA receptor-channels activated by 10 μm glutamate (+ 20 μm glycine). The distribution is fitted with a mixture of five exponential components with means (and areas) as indicated. The fit predicts 2657 events and 1089 were included in the distribution which has a mean of 1069 ms. B and C, shut time distributions for the same patch as data in A, but in which the channels were activated by either 30 μm (B) or 100 μm (C) glutamate. Again each distribution is fitted with a mixture of five exponential components with means (and areas) as indicated; 2982 events were included in the distribution shown in B and 8374 events are predicted by the fit. The overall mean of this distribution is 250 ms. For C, the fit predicts 7133 events, while 2656 were included and the overall mean of this distribution is 69 ms. The dashed lines in B and C indicate the fit obtained from the data shown in A, scaled to take account of the different number of events in each distribution. Note that the time constants (and their respective areas) for the first three components in each distribution are similar.
Figure 2
Figure 2. Single-channel current-voltage relationships and kinetic parameter stability plots for NR1a/NR2A(T671A) NMDA receptor-channels
A, examples of single-channel currents recorded at a series of holding potentials from −100 mV to −20 mV. The presence of a sub-conductance level is clearly visible. B, single-channel current-voltage plot for the two conductance levels. Data points are the mean (±s.d.m.) of the fitted amplitudes of single-channel currents recorded from five experiments. The lines show the least-squares fit of the data and give slope conductances of 50 ± 2 and 40 ± 3 pS for main and sub-conductance levels, respectively. C, stability plot for an experiment where channels were activated by 100 μm glutamate (in the presence of 20 μm glycine) at a holding potential of −100 mV. An average of 100 values (in increments of 50 values) was calculated for each of the parameters shown. The overall mean value for each parameter is indicated by the dashed lines.
Figure 6
Figure 6. NR1a/NR2A(T671A) NMDA receptor-channel currents elicited by brief concentration jumps
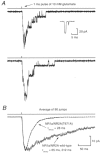
A, two examples of individual sweeps recorded in an outside-out patch following a 1 ms application of 10 mm glutamate. Single-channel events of around 5 pA in amplitude are clearly visible in each of the current traces. The inset in the upper figure shows the liquid junction potential recorded at the end of the experiment when the membrane patch was ruptured by applying positive pressure. The difference in the ionic strengths between the glycine-containing ‘control’ solution and the glutamate + glycine ‘test’ solution was sufficient to allow the detection of a junction potential. The calibration bar refers to the junction potential current trace only. B, the average of ninety such jumps as illustrated in A. The decay of this current is described by a single exponential component with a time constant of 28 ms. Superimposed on this average is an example of a recording made from wild-type NR1a/NR2A recombinant NMDA receptor-channels to illustrate the difference between the deactivation rates of the two receptor combinations. The wild-type recording is taken from data from Wyllie et al. (1998) and has been scaled to give a similar ‘peak’ to that of the average for the NR1a/NR2A(T671A) trace and as such only the time base indicated on the calibration bar applies to the wild-type recording. Calibration bars in B also apply to NR1a/NR2A(T671A) channel recordings shown in A.
Figure 7
Figure 7. NR1a/NR2A(T671A) NMDA receptor-channel currents elicited by 100 ms applications of glutamate: comparison of the deactivation rates with burst lengths
A, examples of two individual sweeps recorded in response to the application of 10 mm glutamate for 100 ms. In this figure the trace above each of the recordings is the junction potential recorded at the end of the experiment following the rupturing of the membrane patch. B, the average of thirty such jumps is shown with the decay of this current fitted with a sum of two exponential components with the time constants fixed to the values obtained from analysis of NR1a/NR2A(T671A) single-channel burst lengths. C, comparison of NR1a/NR2A(T671A) and wild-type NR1a/NR2A responses evoked by 100 ms application of 10 mm glutamate (in the case of mutated receptors) or 1 mm glutamate (in the case of wild-type receptors).
Scheme 1
Scheme 1

References

    1. Anson LC, Chen PE, Wyllie DJA, Colquhoun D, Schoepfer R. Identification of amino acid residues of the NR2A subunit which control glutamate potency in recombinant NR1/NR2A NMDA receptors. Journal of Neuroscience. 1998;18:581–589. - PMC - PubMed
    1. Anson LC, Schoepfer R, Colquhoun D, Wyllie DJA. Single-channel current properties of NMDA receptor-channels, expressed in Xenopus oocytes, that contain a mutation in the glutamate binding site. The Journal of Physiology. 1999;521.P:90P.
    1. Armstrong N, Sun Y, Chen G-Q, Gouaux E. Structure of a glutamate-receptor ligand-binding core in complex with kainate. Nature. 1998;395:913–917. - PubMed
    1. Béhé P, Colquhoun D, Wyllie DJA. Activation of single AMPA- and NMDA-type glutamate-receptors channels. In: Jonas P, Monyer H, editors. Handbook of Experimental Pharmacology. Vol. 141. Berlin: Springer Verlag; 1999. pp. 175–218.
    1. Béhé P, Stern P, Wyllie DJA, Nassar M, Schoepfer R, Colquhoun D. Determination of the NMDA NR1 subunit copy number in recombinant NMDA receptors. Proceedings of the Royal Society B. 1995;262:205–213. - PubMed

Publication types

Substances

LinkOut - more resources