. 2000 Sep 1;19(17):4449-62.
doi: 10.1093/emboj/19.17.4449.

Structural basis of the membrane-targeting and unmasking mechanisms of the radixin FERM domain

Affiliations

Structural basis of the membrane-targeting and unmasking mechanisms of the radixin FERM domain

K Hamada et al. EMBO J. .

Abstract

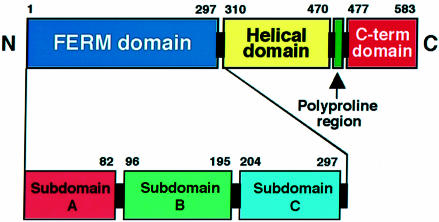
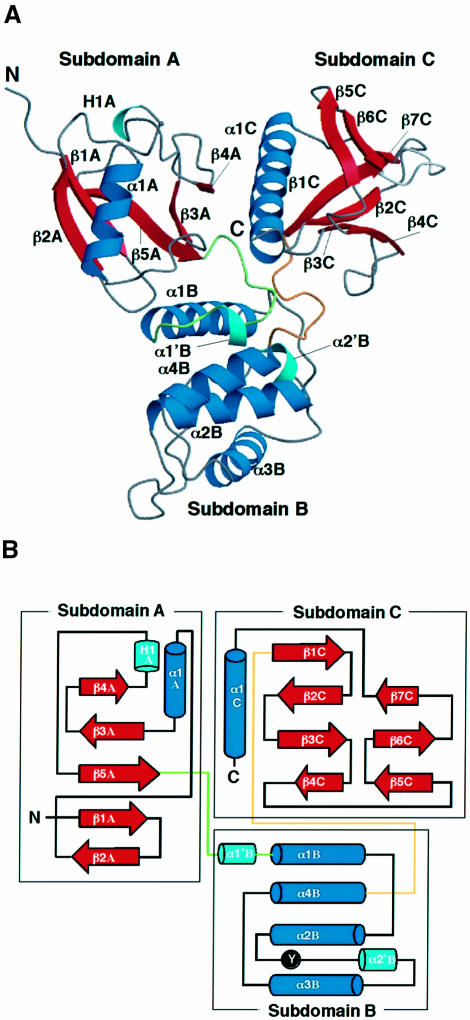
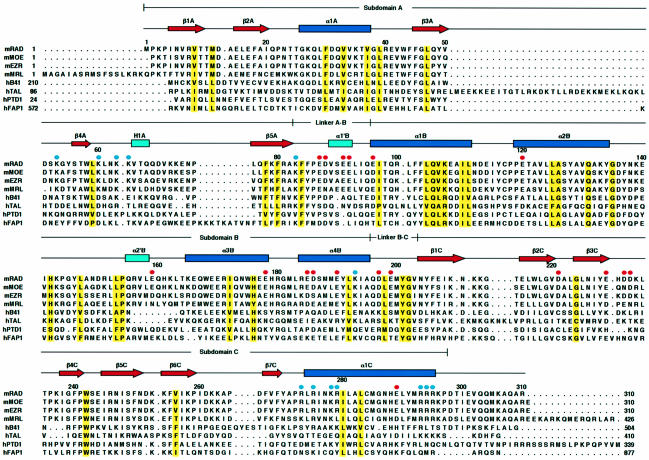
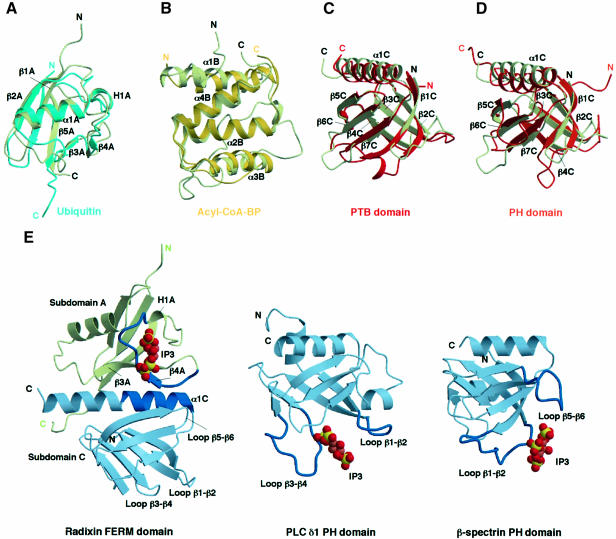
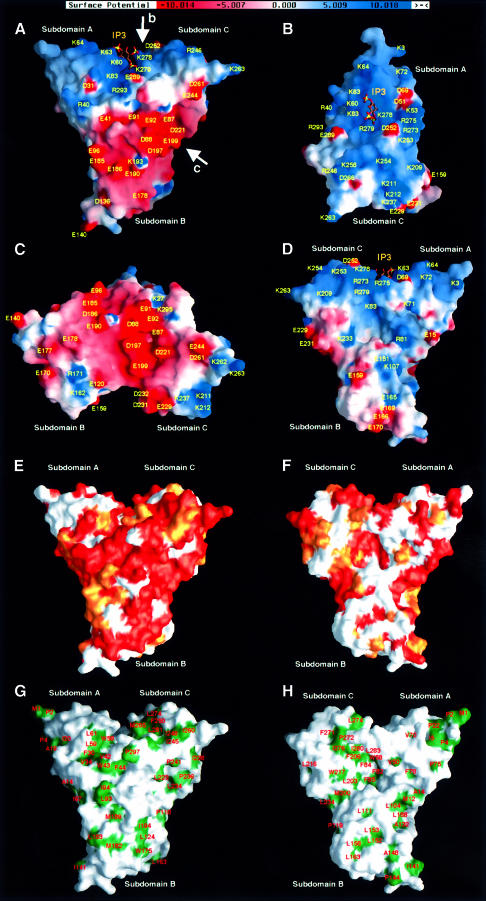
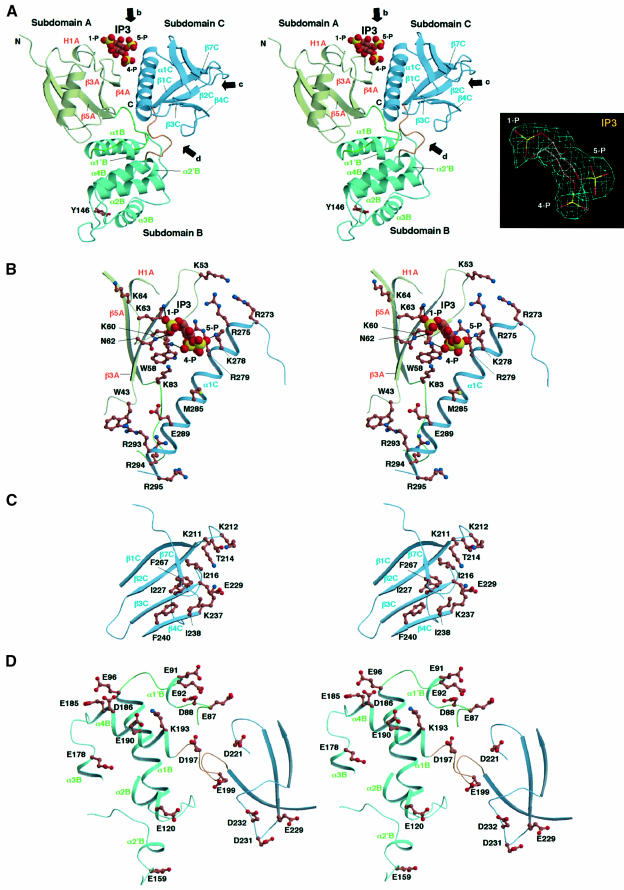
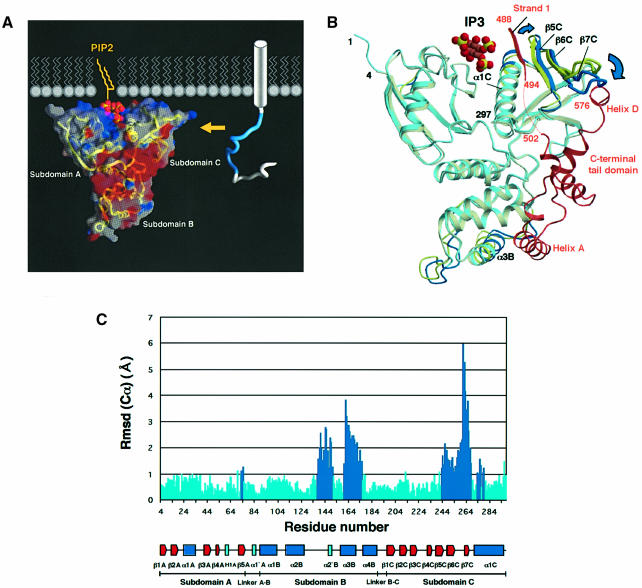
Radixin is a member of the ezrin/radixin/moesin (ERM) family of proteins, which play a role in the formation of the membrane-associated cytoskeleton by linking actin filaments and adhesion proteins. This cross-linking activity is regulated by phosphoinositides such as phosphatidylinositol 4,5-bisphosphate (PIP2) in the downstream of the small G protein Rho. The X-ray crystal structures of the radixin FERM domain, which is responsible for membrane binding, and its complex with inositol-(1,4, 5)-trisphosphate (IP3) have been determined. The domain consists of three subdomains featuring a ubiquitin-like fold, a four-helix bundle and a phosphotyrosine-binding-like domain, respectively. These subdomains are organized by intimate interdomain interactions to form characteristic grooves and clefts. One such groove is negatively charged and so is thought to interact with basic juxta-membrane regions of adhesion proteins. IP3 binds a basic cleft that is distinct from those of pleckstrin homology domains and is located on a positively charged flat molecular surface, suggesting an electrostatic mechanism of plasma membrane targeting. Based on the structural changes associated with IP3 binding, a possible unmasking mechanism of ERM proteins by PIP2 is proposed.


Figures

None
Fig. 1. Diagram of radixin domains. The N-terminal FERM domain (blue), helical domain (yellow), polyproline region (green) and the C-terminal autoinhibitory domain (red) are indicated. Three subdomains in the FERM domain found by this crystallographic analysis are also indicated.
None
Fig. 2. Overall structure of the radixin FERM domain. (A) View of the radixin FERM domain by ribbon representation with secondary structure elements: α-helices (blue) and β-strands (red). Two short α-helices and one 310-helix are colored in light blue. The linkers A–B and B–C are colored in green and brown, respectively. (B) Topology diagram of the radixin FERM domain. Helices are denoted by cylinders and strands by arrows. Tyr146, which is phosphorylated by the protein tyrosine kinase v-Src, is marked.
None
Fig. 3. Secondary structure elements and sequence alignment of the FERM domains. The FERM domains of mouse radixin (mRAD) and the related proteins are aligned with the secondary structure elements of the radixin FERM domain at the top: α-helices (blue rectangles) and β-strands (red arrows). Conserved residues are highlighted in yellow. The aligned FERM domains are mouse moesin (mMOE), ezrin (mEZR), merlin (mMRL) and human band 4.1 (hB41), talin (hTAL), protein tyrosine phosphatase D1 (hPTD1) and FAP-1 (hFAP1). The mouse FERM domains exhibit 100% identities with the human FERM domains and >99.7% identities with other mammalian homologs. Acidic residues of the acidic groove between subdomains B and C are indicated by red circles. Basic residues of the basic cleft between subdomains A and C are indicated by blue circles.
None
Fig. 4. Subdomain structures of the radixin FERM domain. The color codes used are light green for radixin subdomains, light blue for ubiquitin, yellow for acyl-coenzyme A binding protein, red for the PTB domain and orange for the PH domain. (A) Superimposition of radixin subdomain A on ubiquitin (PDB code 1UBI, blue). (B) Superimposition of radixin subdomain B on E.coli acyl-coenzyme A binding protein (yellow, 1ACA). (C) Superimposition of radixin subdomain C on the IRS-1 PTB domain (1QQG, red). (D) Superimposition of radixin subdomain C on the PH domain (1PLS, orange). (E) Comparison of the IP3-binding sites found in the radixin FERM domain (left), the phospholipase C δ1 PH domain (middle) and the β-spectrin PH domain (right). Two loops forming the binding site of each PH domain are colored in blue. The binding site of the radixin FERM domain is located at the basic cleft between subdomains A (a ubiquitin-like fold in light green) and C (a PTB-like fold in light blue) (see text). The N-terminal half of helix α1C of subdomain C and the protruding loop between strands β3A and β5A of subdomain A form the IP3-binding site of the radixin FERM domain and are colored in blue.
None
Fig. 5. Molecular surface properties of the radixin FERM domain. (A) Surface electrostatic potentials of the radixin FERM domain viewed from the same direction as in Figure 2A. Positive (blue) and negative (red) potentials are mapped on the van der Waals surfaces. The IP3 molecule found in the complex crystal is shown in a stick model. (B) Surface electrostatic potentials viewed along the arrow b in (A) to show the basic cleft between subdomains A and C. The IP3 molecule found in the complex crystal is shown in a stick model. (C) Surface electrostatic potentials viewed along arrow c in (A) to show the acidic groove between subdomains B and C. (D) A backside view of surface electrostatic potentials seen in (A). The IP3 molecule found in the complex crystal is shown in a stick model. (E) Conserved residues of the radixin FERM domain mapped on the molecular surfaces. A front view of the radixin FERM domain depicted as a colored molecular surface using a gradient; orange indicates conserved identical residues and white non-conserved residues, while lighter shades of orange indicate semi-invariant residues. A view from the same direction as in (A) and Figure 2A. (F) Back view of conserved residues of the radixin FERM domain. (G) Front view of hydrophobic residues of the radixin FERM domain mapped on the molecular surfaces. (H) Back view of hydrophobic residues of the radixin FERM domain.
None
Fig. 6. Close-up stereo views of the radixin FERM domain. (A) Main chains of subdomains A (light green), B (blue green) and C (blue) are represented by ribbons. Arrows b, c and d indicate views of the basic cleft, the small basic pocket and the acidic groove shown in (B), (C) and (D), respectively. The IP3 molecule is shown in a space-filled model. In subdomain B, the side chain of Tyr146, which is phosphorylated by v-Src kinase, is shown in a stick model. The inset shows the IP3 model in a 2FoFc electron density map contoured at the 1σ level. (B) The basic cleft between subdomains A and C. The protein side chains are shown in ball-and-stick models with color codes of brown for carbon, blue for nitrogen, red for oxygen and yellow for phosphorous atoms. The IP3 molecule is shown in a space-filled model. (C) The hydrophobic hole and the small basic pocket of subdomain C. (D) The acidic groove between subdomains B and C.
None
Fig. 7. Schematic representation of the radixin FERM domain bound to PIP2 in a membrane and its possible unmasking mechanism. (A) The radixin FERM domain is shown in terms of surface electrostatic potentials, with a ribbon representation of the main-chain tracing. Positive (blue) and negative (red) potentials are mapped on the van der Waals surfaces. PIP2 is shown bound to the FERM domain as seen in the current crystal structure. Diacylglycerol (yellow) has been attached to the IP3 head and is shown in a highly schematized lipid layer. A cytoplasmic tail of an adhesion protein such as ICAM-2 is shown in a tube representation with its basic juxta-membrane region in blue. Part of the transmembrane α-helix of the adhesion protein is shown as a cylinder. A yellow arrow indicates a possible binding of the basic juxta-membrane region to the acidic groove of the FERM domain. (B) Superimposition of the radixin FERM domain (light blue) on the moesin FERM domain (pale yellow) complexed with the C-terminal tail domain (brown). Segments displaying large displacements (>1 Å) are highlighted in blue (radixin) and yellow (moesin). (C) A histogram showing the distances of the corresponding Cα atoms between the IP3-bound radixin FERM domain and the moesin FERM domain complexed with the C-terminal tail domain. Large displacements are highlighted in blue.

References

    1. Abrahams J.P. and Leslie,A.G.W. (1996) Methods used in the structure determination of bovine mitochondrial F1 ATPase. Acta Crystallogr. D, 52, 30–42. - PubMed
    1. Algrain M., Turunen,O., Vaheri,A., Louvard,D. and Arpin,M. (1993) Ezrin contains cytoskeleton and membrane binding domains accounting for its proposed role as a membrane-cytoskeletal linker. J. Cell Biol., 120, 129–139. - PMC - PubMed
    1. Amieva M.R. and Furthmayr,H. (1995) Subcellular localization of moesin in dynamic filopodia, retraction fibers, and other structures involved in substrate exploration, attachment, and cell–cell contacts. Exp. Cell Res., 219, 180–196. - PubMed
    1. Andreoli C., Martin,M., Le Borgne,R., Reggio,H. and Mangeat,P. (1994) Ezrin has properties to self-associate at the plasma membrane. J. Cell Sci., 107, 2509–2521. - PubMed
    1. Arpin M., Algrain,M. and Louvard,D. (1994) Membrane–actin microfilament connections: an increasing diversity of players related to band 4.1. Curr. Opin. Cell Biol., 6, 136–141. - PubMed

Publication types

MeSH terms