. 2000 Sep 1;19(17):4543-54.
doi: 10.1093/emboj/19.17.4543.

The Drosophila cyclin D-Cdk4 complex promotes cellular growth

Affiliations

The Drosophila cyclin D-Cdk4 complex promotes cellular growth

S A Datar et al. EMBO J. .

Abstract

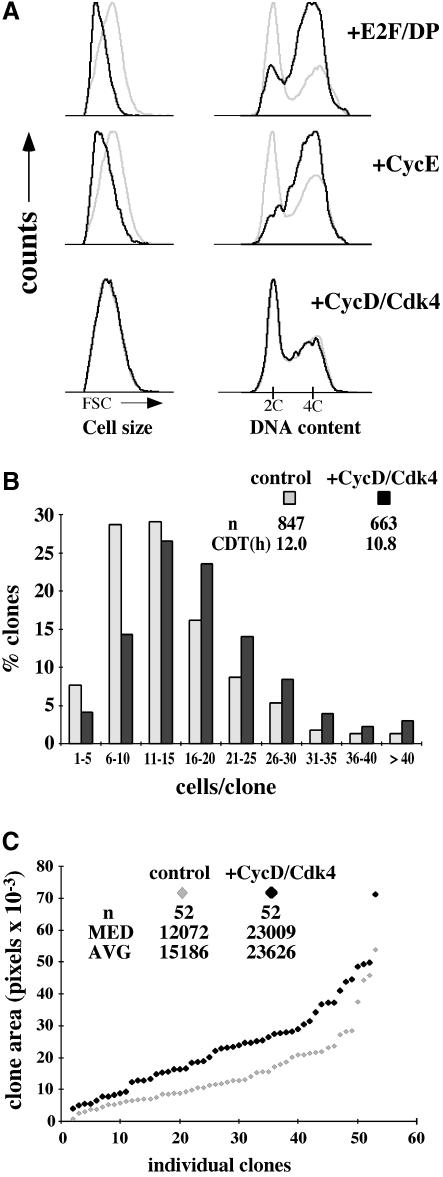
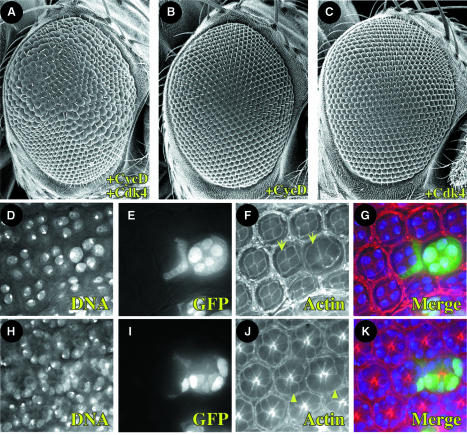
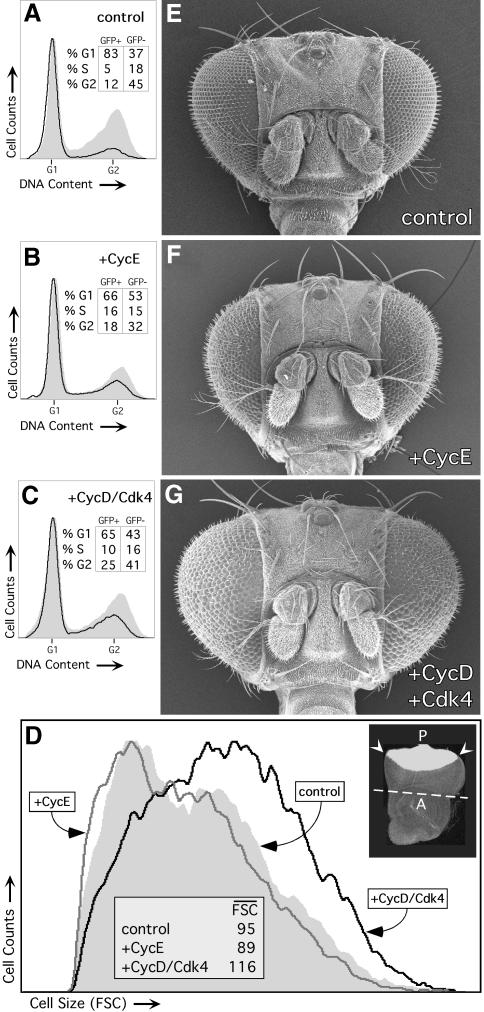
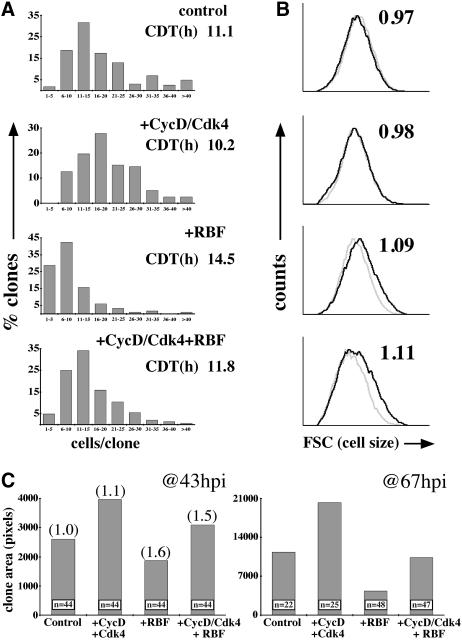
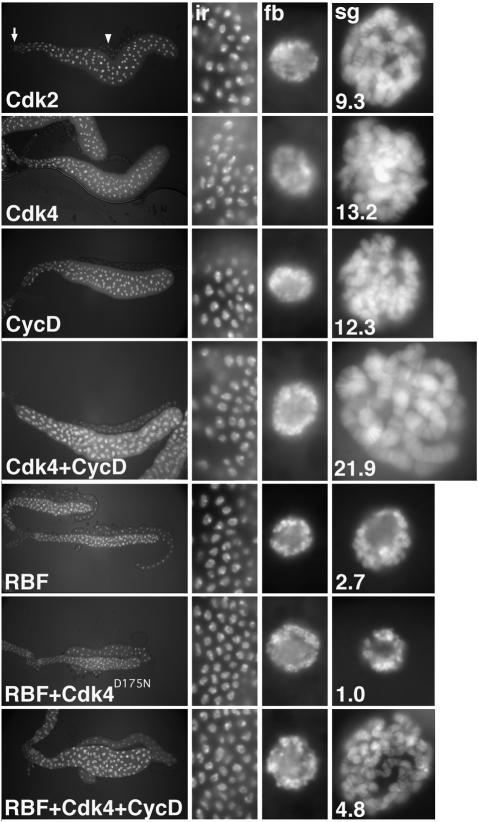
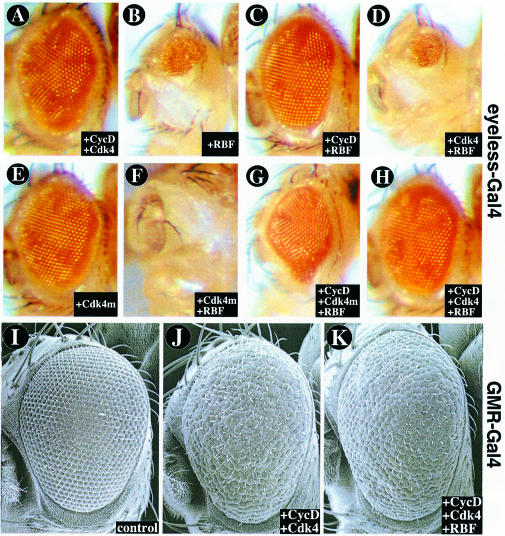
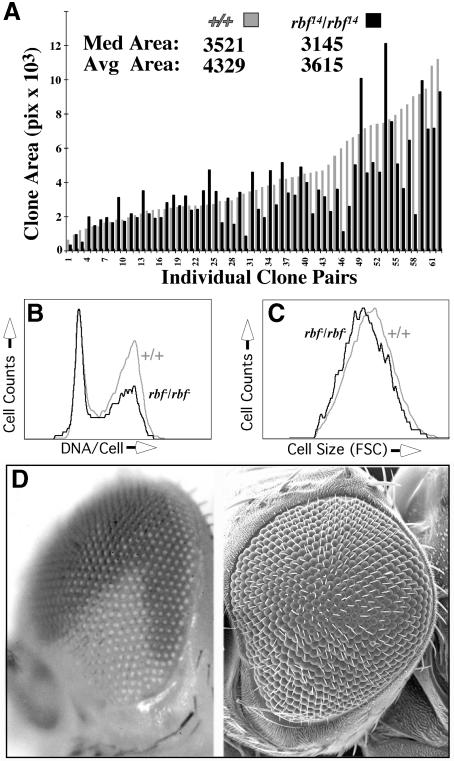
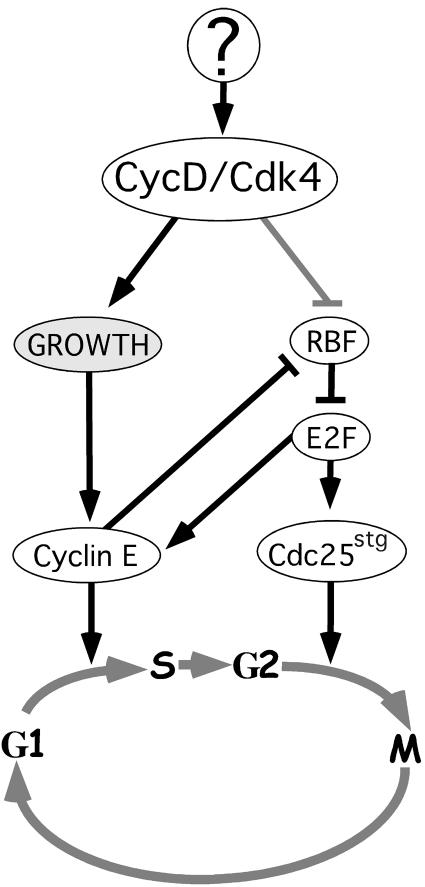
Mammalian cyclin D-Cdk4 complexes have been characterized as growth factor-responsive cell cycle regulators. Their levels rise upon growth factor stimulation, and they can phosphorylate and thus neutralize Retinoblastoma (Rb) family proteins to promote an E2F-dependent transcriptional program and S-phase entry. Here we characterize the in vivo function of Drosophila Cyclin D (CycD). We find that Drosophila CycD-Cdk4 does not act as a direct G(1)/S-phase regulator, but instead promotes cellular growth (accumulation of mass). The cellular response to CycD-Cdk4-driven growth varied according to cell type. In undifferentiated proliferating wing imaginal cells, CycD-Cdk4 caused accelerated cell division (hyperplasia) without affecting cell cycle phasing or cell size. In endoreplicating salivary gland cells, CycD-Cdk4 caused excessive DNA replication and cell enlargement (hypertrophy). In differentiating eyes, CycD-Cdk4 caused cell enlargement (hypertrophy) in post-mitotic cells. Interaction tests with a Drosophila Rb homolog, RBF, indicate that CycD-Cdk4 can counteract the cell cycle suppressive effects of RBF, but that its growth promoting activity is mediated at least in part via other targets.


Figures

None
Fig. 1. Effects of overexpressed CycD–Cdk4 in imaginal wing disc cells. (A) Overexpression clones were induced 48 h after egg deposition (AED) using the flip-out Gal4 technique and analyzed by FACS at 96 h after AED. Light traces represent GFP-negative (wild-type) cells, and dark traces represent GFP-positive (experimental) cells. Relative cell size is shown on the left by forward light scatter (FSC), and cell cycle profile (DNA) is on the right. (B) Clones were induced at 72 h AED and analyzed after fixation at 115.5 h AED. The distribution of number of cells per clone as a percentage of the total number of clones for each genotype is shown. Number of clones scored (n) and median cell doubling time (CDT) are indicated, P <0.002. Control cells expressed GFP alone. (C) Clones were induced at 48 h AED. Discs were fixed at 115.5 h AED. Fifty-two random clones of each genotype were analyzed and plotted individually in order of increasing size. Values for median and average area per clone are indicated, P <0.002. All controls were done in parallel.
None
Fig. 2. Clonal expression of CycD–Cdk4 promotes cellular hypertrophy in the eye. (A–C) Overexpression clones were induced during embryonic development (12–16 h AED), and adult eyes were analyzed 3 days after eclosion. Lateral view SEMs at 200×. Anterior is to the right, dorsal is up. Genotypes are (A) hs-FLP; UAS-CycD UAS-Cdk4; Act>Cd2>Gal4 UAS-GFP; (B) hs-FLP; UAS-CycD; Act>Cd2>Gal4 UAS-GFP; (C) hs-FLP; UAS-Cdk4; Act>Cd2>Gal4 UAS-GFP. (DK) Clones overexpressing CycD–Cdk4 were induced at 72 h AED, and pupal discs were fixed 96 h later at 48 h after puparium formation (APF). Optical sections are of the same eye field at superficial (cone cell level, D–G) and deep (photoreceptor level, H–K) layers. GFP marks cells overexpressing CycD–Cdk4 (E, I, G and K), DAPI marks nuclei (D, H, G and K) and rhodamine-conjugated phalloidin marks cell membranes (F, J, G and K). Photoreceptor cells (arrowhead) and cone cells (arrow) are labeled accordingly. Compare analogous cell types with or without GFP (+/– CycD–Cdk4).
None
Fig. 3. GMR-Gal4-driven expression of CycD–Cdk4, but not CycE, causes hypertrophy of the eye. A–D show FACS analyses of eye discs in which GMR-Gal4 was used to co-express UAS-GFP with the genes indicated in differentiating cells posterior to the morphogenetic furrow (MF; see inset in D). (AC) Expressing GFP-positive, posterior cells are denoted by black traces, and GFP-negative, anterior cells are denoted by gray shaded plots. Both CycE (B) and CycD–Cdk4 (C) increase S and G2 in cells posterior to the MF (dark traces). (D) Cell size of GFP-positive posterior cells measured by FSC. Mean FSC values are listed. Right inset shows GFP expression in a control eye–antennal disc. The division between the posterior (P) eye region and the anterior (A) antennal region is marked (white line), and the MF is indicated (arrowheads). FACS was performed on the eye region only. (E–G) show SEM images of GMR-Gal4/CyO (control, E); GMR-Gal4/UAS-CycE (+CycE, F); and GMR-Gal4 UAS-CycD UAS-Cdk4/CyO (+CycD–Cdk4, G) females. Genotypes used in (A–D) were the same except for the inclusion of UAS–GFP.
None
Fig. 4. Opposing effects of CycD–Cdk4 and RBF in wing imaginal discs. (A) Flip-out Gal4 clones expressing GFP and the genes indicated were induced at 72 h AED and fixed at 115.5 h AED. Distribution of clone size for the genotypes given is shown. Cell doubling times (CDTs) are indicated. Total number of clones analyzed (n): control = 161; CycD–Cdk4 = 158; RBF = 184; CycD–Cdk4 + RBF = 144. Comparison of cell number/clone for CycD–Cdk4 + RBF with each of the other three genotypes, P <0.003. (B) Clones were induced at 48 h AED and analyzed by FACS at 96 h AED. Light trace represents GFP-negative (wild-type) cells, and dark trace represents GFP-positive (experimental) cells. Ratio of mean cell size (GFP+/GFP–) is indicated at top right. (C) Clones were induced at either 48 or 72 h AED and fixed at 115 or 116 h AED, respectively. Comparison of clone areas between genotypes at each time-point, P <0.05, except between control and CycD–Cdk4 + RBF, P >0.6. Median cell number/clone was established for 44 h clones of each genotype: control, 18; CycD–Cdk4, 25; RBF, 8; CycD–Cdk4 + RBF, 14, P <0.04 for comparison of cell number/clone between all genotypes, including control and CycD–Cdk4 + RBF. This number divided into the average clone area gave a relative cell size, shown in parentheses in (C). CycD–Cdk4 + RBF-expressing clones encompassed as great an area as control clones with significantly fewer cells per clone; thus, CycD–Cdk4 + RBF cells are larger than wild type.
None
Fig. 5. Opposing effects of CycD–Cdk4 and RBF on salivary gland growth. Salivary glands were dissected from larvae expressing either Cdk2, Cdk4, CycD, Cdk4 + CycD, RBF, RBF + Cdk4D175N-myc or RBF + Cdk4 + CycD under F4-GAL4/UAS control, at third instar wandering stage. Panels from left to right show DNA labeling in complete salivary glands, and at a higher but constant magnification in imaginal ring cells (ir), fat body cell nuclei (fb), and salivary gland cell nuclei (sg). The DNA signal ratio of expressing salivary gland nuclei and control, non-expressing fat body nuclei averaged from at least three different glands as described by Weiss et al. (1998) is indicated by the white numbers in the right panels. Cdk2 expression, shown for a control, was indistinguishable from wild type (Weiss et al., 1998; data not shown).
None
Fig. 6. CycD–Cdk4 and RBF interactions in the eye. (AH) show light micrographs of eyes overexpressing the genes indicated under ey-Gal4 control, which activates UAS target genes throughout the eye beginning early in development. Using the ey-Gal4 driver, overexpressed RBF suppresses eye growth (B), and this effect is counteracted by CycD (C) or CycD–Cdk4 (H). The catalytically inactive variant Cdk4D175N-myc (Cdk4m) acts synergistically with RBF in suppressing eye growth (F and G). (IK) show SEM images of eyes overexpressing the genes indicated under GMR-Gal4 control, which activates its UAS targets late in eye development at the onset of cell differentiation. Using GMR-Gal4, CycD–Cdk4 causes overgrowth (J), but this effect is not neutralized by co-expressed RBF (K).
None
Fig. 7. Loss of RBF does not promote overgrowth in the wing or the eye. (Arbf14/rbf14 and +/+ sister clones (twin spots) were induced by FLP/FRT-mediated mitotic recombination at 48 h AED, and scored in wing imaginal discs at 115 h AED. The areas of both mutant and wild-type clones were measured; rbf14/rbf14 mutant clone areas are displayed as black bars, and are paired with their +/+ wild-type sister clones (gray bars). Data are arrayed according to size of the sister clone. Values for median and average clone areas are indicated. P >0.1. Genotype: w; FRT18A 2πmyc/FRT18A rbf14; hs-FLP/+. (B) FACS analysis of rbf14/rbf14 cells (black trace) in wing discs, showing an increase in the G1 cell population relative to control cells (gray trace) from the same discs. Genotype: w; FRT18A P[w+ub-GFPnls]/FRT18A rbf14; hs-FLP/+. (C) FACS analysis of rbf14/rbf14 cells (black trace) in wing discs, showing a decreased cell size as measured by FSC relative to internal control cells (gray trace). Genotype as in (B). (D) An eye containing a large rbf14/rbf14 clone (white area) generated using the Minute technique. An SEM of the same eye is shown to the right; note that the rbf14/rbf14 clone does not show enlarged ommatidia. Approximately 100 such eyes were examined. Genotype: w; FRT18A P[w+ub-GFPnls] M(1)15DRpS52/FRT18A rbf14; hs-FLP/+.
None
Fig. 8. Model for CycD–Cdk4 function based on data presented here and in Neufeld et al. (1998) and Prober and Edgar (2000).

References

    1. Asano M., Nevins,J.R. and Wharton,R.P. (1996) Ectopic E2F expression induces S-phase and apoptosis in Drosophila imaginal discs. Genes Dev., 10, 1422–1432. - PubMed
    1. Beijersbergen R.L. and Bernards,R. (1996) Cell cycle regulation by the retinoblastoma family of growth inhibitory proteins. Biochim. Biophys. Acta, 1287, 103–120. - PubMed
    1. Böhni R., Riesgo-Escovar,J., Oldham,S., Brogiolo,W., Stocker,H., Andruss,B.F., Beckingham,K. and Hafen,E. (1999) Autonomous control of cell and organ size by CHICO, a Drosophila homolog of vertebrate IRS1-4. Cell, 97, 865–875. - PubMed
    1. Brand A.H. and Perrimon,N. (1993) Targeted gene expression as a means of altering cell fates and generating dominant phenotypes. Development, 118, 401–415. - PubMed
    1. Cockcroft C.E., den Boer,B.G., Healy,J.M. and Murray,J.A. (2000) Cyclin D control of growth rate in plants. Nature, 405, 575–579. - PubMed

Publication types

LinkOut - more resources