. 2000 Sep 1;19(17):4838-45.
doi: 10.1093/emboj/19.17.4838.

Structure of the ArsA ATPase: the catalytic subunit of a heavy metal resistance pump

Affiliations

Structure of the ArsA ATPase: the catalytic subunit of a heavy metal resistance pump

T Zhou et al. EMBO J. .

Abstract

Active extrusion is a common mechanism underlying detoxification of heavy metals, drugs and antibiotics in bacteria, protozoa and mammals. In Escherichia coli, the ArsAB pump provides resistance to arsenite and antimonite. This pump consists of a soluble ATPase (ArsA) and a membrane channel (ArsB). ArsA contains two nucleotide-binding sites (NBSs) and a binding site for arsenic or antimony. Binding of metalloids stimulates ATPase activity. The crystal structure of ArsA reveals that both NBSs and the metal-binding site are located at the interface between two homologous domains. A short stretch of residues connecting the metal-binding site to the NBSs provides a signal transduction pathway that conveys information on metal occupancy to the ATP hydrolysis sites. Based on these structural features, we propose that the metal-binding site is involved directly in the process of vectorial translocation of arsenite or antimonite across the membrane. The relative positions of the NBS and the inferred mechanism of allosteric activation of ArsA provide a useful model for the interaction of the catalytic domains in other transport ATPases.


Figures
None
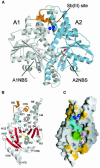
Fig. 1. (A) Overall structure of the ArsA ATPase. A front view of the enzyme is shown looking down the central cavity along a direction perpendicular to the pseudo-2-fold axis of symmetry that relates the A1 and A2 domains. The secondary structure elements are drawn as ribbon diagrams. A1 is colored in ivory, A2 in sky blue; helices H9–H10 of A1, which seal the antimony-binding site from above, are colored in orange. The equivalent helices of A2 are disordered and are not visible in the structure. Bound Sb(III) and Mg2+ are shown as space-filling models, and colored in blue and hot pink, respectively. ADP bound in the two NBSs is shown with ball-and-stick and colored according to atom type (phosphorus, yellow; oxygen, red; nitrogen, blue). (B) Structure of the A1 domain, viewed from the side that interacts with the A2 domain [this is equivalent to a rotation by 90° with respect to the view of the A1 domain shown in (A)]. The central core of eight strands is colored in red, and helices H9 and H10 are colored in orange as in (A). The P-loop and the DTAPTGH sequence (see text for details) are colored in chartreuse and cyan, respectively. The structure of the A2 domain is essentially identical to that of the A1 domain. (C) Molecular surface of the A1 domain viewed from the same angle as in (B). The P-loop and the DTAPTGH sequence are colored in chartreuse and cyan, respectively, as in (B). Regions of the molecular surface of the A1 domain that are <1.4 Å from the molecular surface of the A2 domain are highlighted in yellow or dark green (for the component of the P-loop), or in dark cyan (for the component of the DTAPTGH sequence). Bound Sb(III) and Mg2+ are shown as space-filling models, and colored in blue and hot pink, respectively. ADP bound in the A1 NBS is shown with ball-and-stick and colored according to atom type (phosphorus, yellow; oxygen, red; nitrogen, blue). H, helix; S, strand. Generated with MOLSCRIPT (Kraulis, 1991), RASTER3D (Merritt and Murphy, 1994) and GRASP (Nichols et al., 1991).
None
Fig. 2. The nucleotide-binding sites of ArsA. Two views of the molecular surface of ArsA show the relative positions of the A1 and A2 domains, and details of ADP bound in the A1 NBS (left image) and in the A2 NBS (right image). The A2 NBS appears more accessible than the A1 NBS. Generated with GRASP (Nichols et al., 1991).
None
Fig. 3. Polar contacts of Mg-ADP at the A1 and A2 NBS. The octahedral coordination of Mg2+ is clearly evident. Asp142 and Asp447, representing the N-terminal ends of the signal transduction pathways, interact with Mg-ADP via water molecules. The ‘closed’ conformation of the A1 site is reflected by the presence of some short range interactions of the adenine nucleotide with residues of the A2 domain (see text for details). Distances are expressed in angstroms.
None
Fig. 4. The allosteric site of ArsA. An electron density map of the metal-binding site of ArsA is shown with a section of the refined model. The map, calculated with the amplitudes of the native data set and MAD phases improved with density modification and extended to 2.3 Å, is displayed as a transparent surface contoured at 1.2σ. Each antimony is coordinated by one residue from the A1 half, one residue from the A2 half and a non-protein ligand (most probably chloride). Antimony and chloride are shown as space-filling models and colored in dark blue and magenta, respectively. The A1 backbone is colored in chartreuse, the A2 backbone in cyan. Generated with BOBSCRIPT (Esnouf, 1997) and RASTER3D (Merritt and Murphy, 1994).
None
Fig. 5. The signal transduction pathway. Two stretches of seven residues with the identical sequence D142/447TAPTGH148/453 connect the A1 and A2 NBS to the metal-binding site. Strands (dark orange), helices (ivory) and P-loops (chartreuse) are drawn as ribbons. The nucleotides bound in the two NBSs are shown as ball-and-stick models colored according to atom type (phosphorus, yellow; oxygen, red; nitrogen, blue). The DTAPTGH sequences are shown as stick models with cyan bonds. Sb(III) (blue) and Mg2+ (hot pink) are shown as space-filling models. Generated with MOLSCRIPT (Kraulis, 1991) and RASTER3D (Merritt and Murphy, 1994).

References

    1. Adams P.D., Pannu,N.S., Read,R.J. and Brünger,A.T. (1997) Cross-validated maximum likelihood enhances crystallographic simulated annealing refinement. Proc. Natl Acad. Sci. USA, 94, 5018–5023. - PMC - PubMed
    1. Ambudkar S.V., Dey,S., Hrycyna,C.A., Ramachandra,M., Pastan,I. and Gottesman,M.M. (1999) Biochemical, cellular and pharmacological aspects of the multidrug transporter. Annu. Rev. Pharmacol. Toxicol., 39, 361–398. - PubMed
    1. Bhattacharjee H. and Rosen,B.P. (1996) Spatial proximity of Cys113, Cys172 and Cys422 in the metalloactivation domain of the ArsA ATPase. J. Biol. Chem., 271, 24465–24470. - PubMed
    1. Bhattacharjee H., Li,J., Ksenzenko,M.Y. and Rosen,B.P. (1995) Role of cysteinyl residues in metalloactivation of the oxyanion-translocating ArsA ATPase. J. Biol. Chem., 270, 11245–11250. - PubMed
    1. Brünger A.T. et al. (1998) Crystallography and NMR system: a new software suite for macromolecular structure determination. Acta Crystallogr. D, 54, 905–921. - PubMed

Publication types