An immunoglobulin G1 monoclonal antibody highly specific to the wall of Cryptosporidium oocysts
- PMID: 10973448
- PMCID: PMC95949
- DOI: 10.1128/CDLI.7.5.745-750.2000
An immunoglobulin G1 monoclonal antibody highly specific to the wall of Cryptosporidium oocysts
Abstract
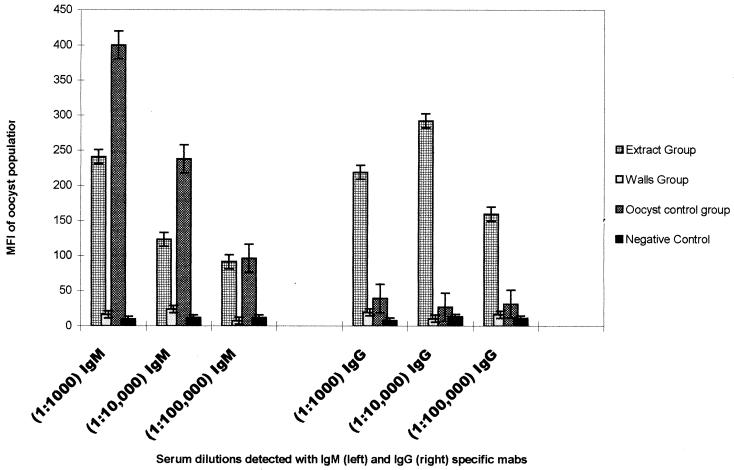
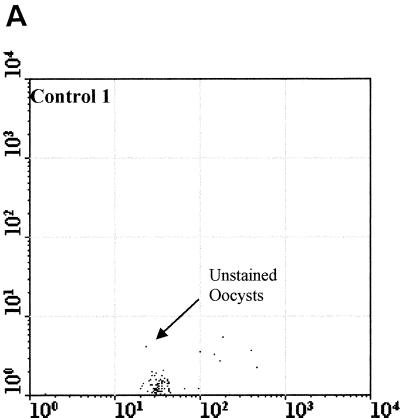
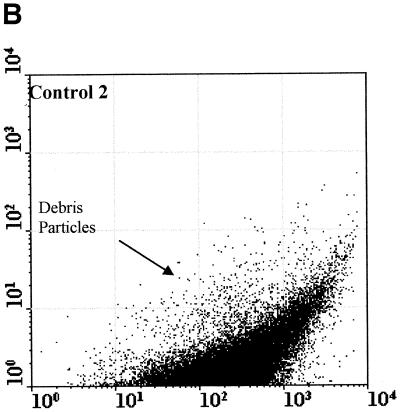
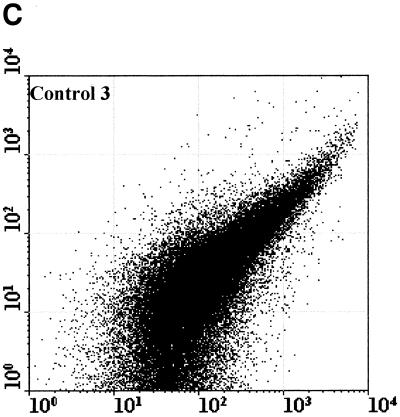
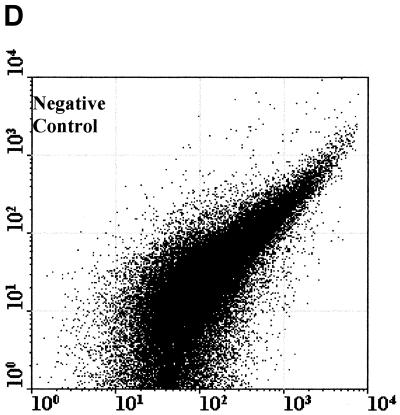
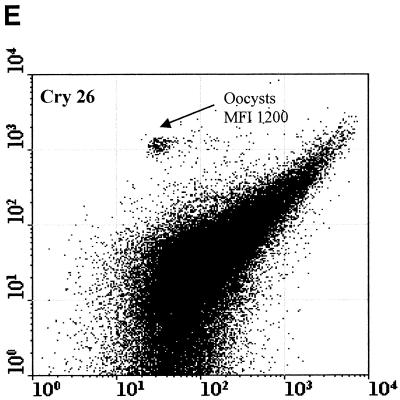
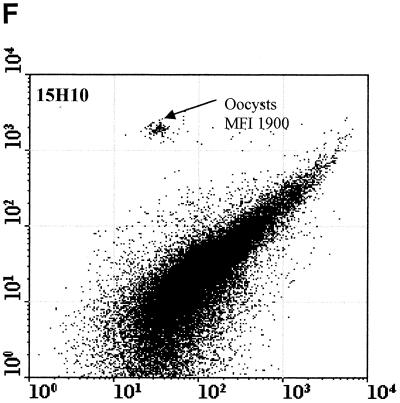
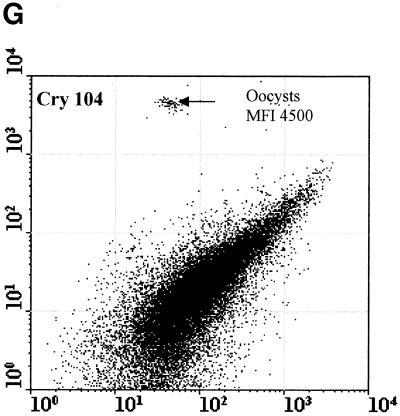
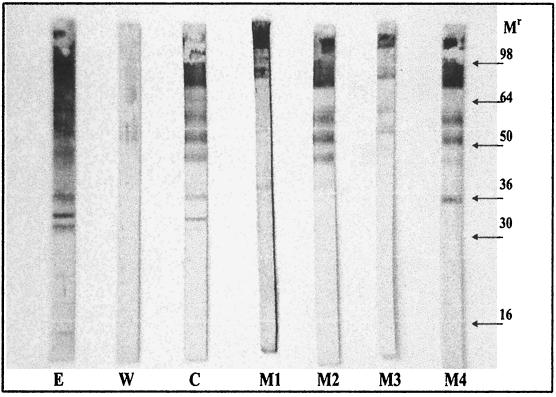
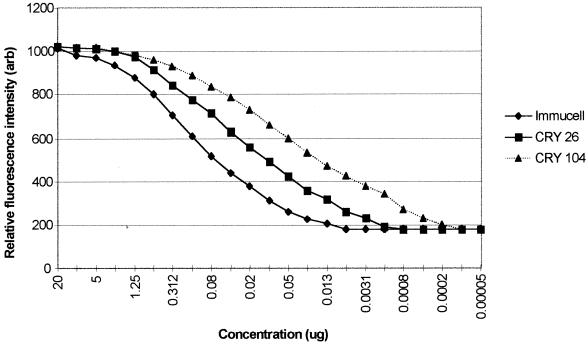
The detection of Cryptosporidium oocysts in drinking water is critically dependent on the quality of immunofluorescent reagents. Experiments were performed to develop a method for producing highly specific antibodies to Cryptosporidium oocysts that can be used for water testing. BALB/c mice were immunized with six different antigen preparations and monitored for immunoglobulin G (IgG) and IgM responses to the surface of Cryptosporidium oocysts. One group of mice received purified oocyst walls, a second group received a soluble protein preparation extracted from the outside of the oocyst wall, and the third group received whole inactivated oocysts. Three additional groups were immunized with sequentially prepared oocyst extracts to provide for a comparison of the immune response. Mice injected with the soluble protein extract demonstrated an IgG response to oocysts surface that was not seen in the whole-oocyst group. Mice injected with whole oocysts showed an IgM response only, while mice injected with purified oocyst walls showed little increase in IgM or IgG levels. Of the additional reported preparations only one, BME (2-mercaptoethanol treated), produced a weak IgM response to the oocyst wall. A mouse from the soluble oocyst extract group yielding a high IgG response was utilized to produce a highly specific IgG(1) monoclonal antibody (Cry104) specific to the oocyst surface. Comparative flow cytometric analysis indicated that Cry104 has a higher avidity and specificity to oocysts in water concentrates than other commercially available antibodies.
Figures
Similar articles
-
A common oocyst surface antigen of Cryptosporidium recognized by monoclonal antibodies.Parasitol Res. 2002 May;88(5):412-20. doi: 10.1007/s00436-001-0586-z. Parasitol Res. 2002. PMID: 12049457
-
Characteristics and specificity of hybridoma antibodies against oocyst antigens of Cryptosporidium parvum from man.Parasite Immunol. 1991 May;13(3):251-9. doi: 10.1111/j.1365-3024.1991.tb00280.x. Parasite Immunol. 1991. PMID: 1712929
-
Ultrastructural localization of Cryptosporidium parvum antigen using human patients sera.Korean J Parasitol. 2009 Jun;47(2):171-4. doi: 10.3347/kjp.2009.47.2.171. Epub 2009 May 27. Korean J Parasitol. 2009. PMID: 19488425 Free PMC article.
-
Characterization and immunolocalization of an oocyst wall antigen of Cryptosporidium parvum (Protozoa: Apicomplexa).Parasitology. 1991 Oct;103 Pt 2:171-7. doi: 10.1017/s0031182000059448. Parasitology. 1991. PMID: 1720886
-
Cryptosporidium parvum and Cyclospora cayetanensis: a review of laboratory methods for detection of these waterborne parasites.J Microbiol Methods. 2002 May;49(3):209-24. doi: 10.1016/s0167-7012(02)00007-6. J Microbiol Methods. 2002. PMID: 11869786 Review.
Cited by
-
Evidence for mucin-like glycoproteins that tether sporozoites of Cryptosporidium parvum to the inner surface of the oocyst wall.Eukaryot Cell. 2010 Jan;9(1):84-96. doi: 10.1128/EC.00288-09. Epub 2009 Nov 30. Eukaryot Cell. 2010. PMID: 19949049 Free PMC article.
-
Monoclonal Antibodies to Intracellular Stages of Cryptosporidium parvum Define Life Cycle Progression In Vitro.mSphere. 2018 May 30;3(3):e00124-18. doi: 10.1128/mSphere.00124-18. Print 2018 Jun 27. mSphere. 2018. PMID: 29848759 Free PMC article.
-
MSP22.8 is a protease inhibitor-like protein involved in shell mineralization in the edible mussel Mytilus galloprovincialis.FEBS Open Bio. 2017 Sep 17;7(10):1539-1556. doi: 10.1002/2211-5463.12286. eCollection 2017 Oct. FEBS Open Bio. 2017. PMID: 28979842 Free PMC article.
-
Patterns of Cryptosporidium oocyst shedding by eastern grey kangaroos inhabiting an Australian watershed.Appl Environ Microbiol. 2005 Oct;71(10):6159-64. doi: 10.1128/AEM.71.10.6159-6164.2005. Appl Environ Microbiol. 2005. PMID: 16204534 Free PMC article.
-
Prevalence and genetic characterization of Cryptosporidium isolates from common brushtail possums (Trichosurus vulpecula) adapted to urban settings.Appl Environ Microbiol. 2008 Sep;74(17):5549-55. doi: 10.1128/AEM.00809-08. Epub 2008 Jul 18. Appl Environ Microbiol. 2008. PMID: 18641156 Free PMC article.
References
-
- Catty D. Antibodies: a practical approach. Oxford, England: IRL Press; 1988. pp. 7–58.
-
- Dupont H L, Chappell C L, Sterling C R, Rose J B, Jakubowski W. The infectivity of Cryptosporidium parvum in healthy volunteers. N Engl J Med. 1995;332:855–859. - PubMed
-
- Ey P L, Prowse S J, Jenkin C R. Isolation of pure IgG1, IgG2a and IgG2b immunoglobulins from mouse serum using protein A-Sepharose. Biochemistry. 1978;15:129–144. - PubMed
Publication types
MeSH terms
Substances
LinkOut - more resources
Full Text Sources
Other Literature Sources