. 2000 Sep;157(3):825-31.
doi: 10.1016/S0002-9440(10)64596-8.

In situ localization of C3 synthesis in experimental acute renal allograft rejection

Affiliations

In situ localization of C3 synthesis in experimental acute renal allograft rejection

J R Pratt et al. Am J Pathol. 2000 Sep.

Abstract

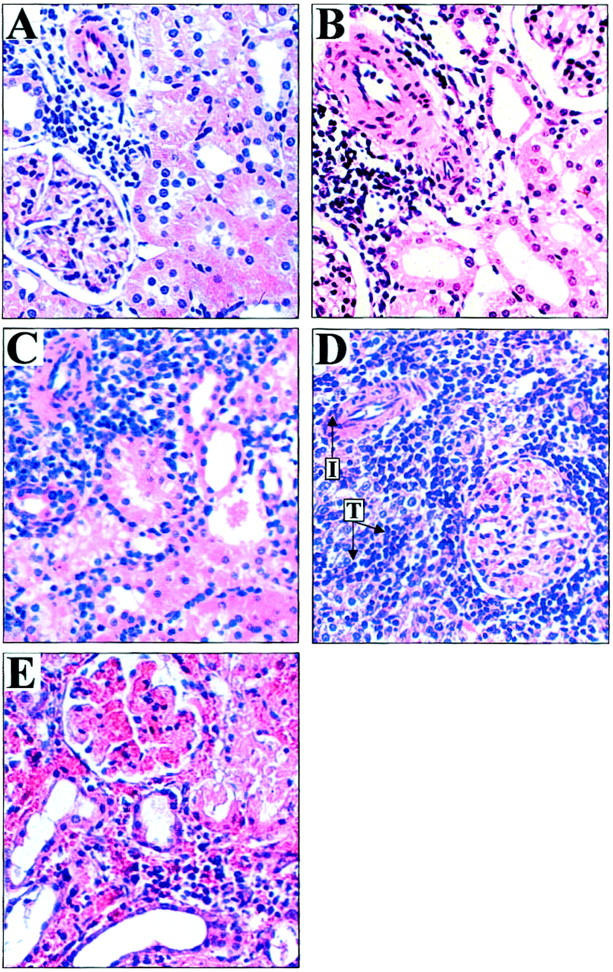
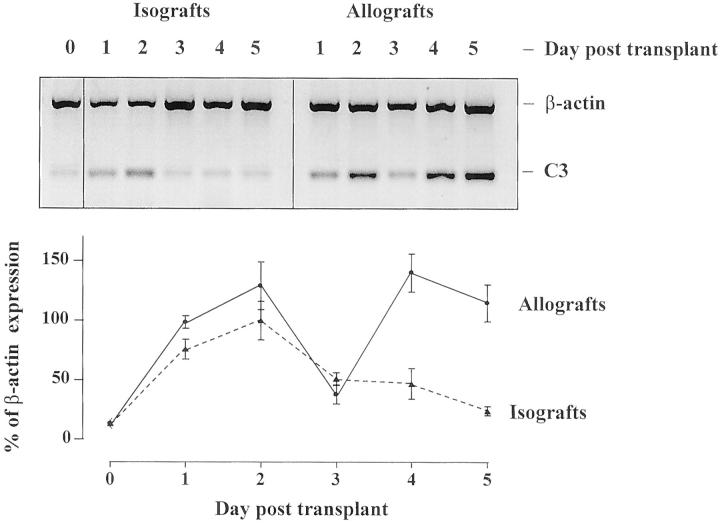
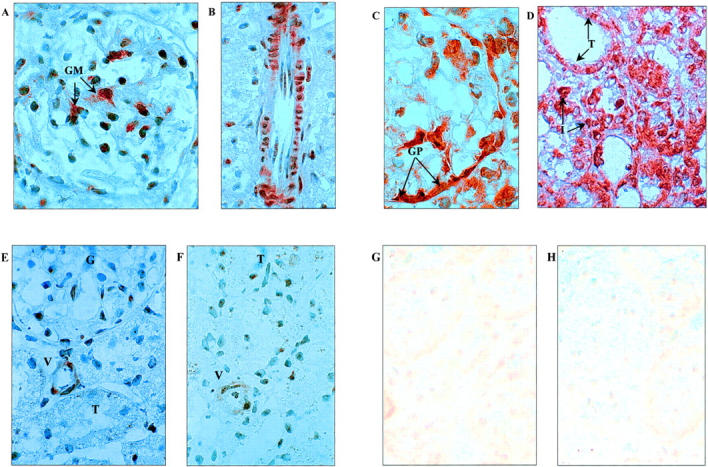
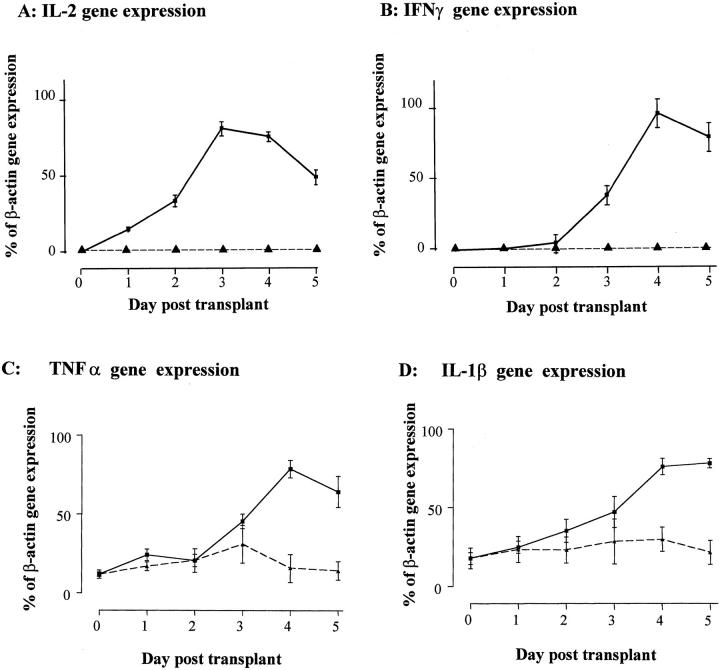
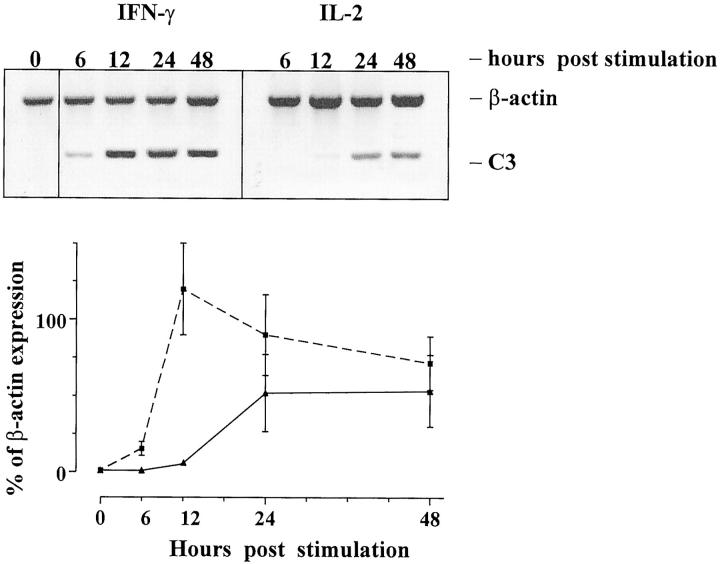
Recent evidence has implicated complement in renal transplant injury and identified the kidney as a source of complement components. We therefore investigated the local gene expression of complement component C3, pivotal to complement activation pathways and a mediator of inflammatory injury, in a rat renal transplant model. By reverse transcriptase-polymerase chain reaction, the expression of C3 mRNA increased in two phases. The first phase coincided with post-ischemic injury over 2 days post-transplantation and was localized by in situ hybridization to vessels and glomerular mesangial cells in allogeneic and syngeneic (control) kidney transplants. In allografts only, a second phase was found in tubular epithelial cells, glomerular parietal cells, vessel walls and some infiltrating cells, which peaked on day 4 together with rapid influx of leukocytes, tubule cell damage, the induction of interleukin-2 and interferon-gamma mRNA, and the up-regulation of tumor necrosis factor-alpha and interleukin-1beta mRNA in the graft. In vitro studies showed that interleukin-2 and interferon-gamma up-regulate C3 production in renal tubule cells. We conclude that post-ischemic injury led to transient up-regulation of glomerular expression of C3 mRNA. Subsequent cellular rejection was associated with tubulointerstitial/glomerular parietal cell expression of C3 mRNA. This differential expression of local C3, immediately post-transplant or associated with acute rejection, may have implications for putative therapeutic complement inhibition in clinical transplantation.


Figures

Figure 1.
Figure 1.
The histopathology of renal allograft rejection. Lewis to DA renal allograft pathology by H&E staining (×250). By day 1 post-transplant (A), thinning of tubules indicative of acute tubular necrosis (ATN) was the predominant pathological lesion. These changes peaked in severity at day 2 (B) and were present in syngeneic grafts (not shown) and therefore indicative of ischemia/reperfusion injury. By day 3 (C) allografted organs were recovering from ATN but showed increasing perivascular and periglomerular infiltration by leukocytes. On day 4 (D) a marked increase in leukocyte infiltration was seen accompanied by tubulitis (T) and vascular inflammation (I). At day 5 (E), grafts showed severe tubulitis, hemorrhage, thrombosis, and infarction. At this point tissues were judged to have reached Banff Grade III severe acute rejection.
Figure
Figure
Figure 2.
Figure 2.
C3 mRNA expression in allografts and isografts by RT-PCR. Representative bands of β-actin and C3 RT-PCR from rat renal allografts and isografts are shown. The graph shows the basal expression of C3 in normal kidney (day 0) up-regulated in allografts ( ) and isografts (- - ▴- - ) by day 1 post-transplant. This initial peak declined by day 3 in both groups. In allografts alone a second phase of C3 mRNA expression was detected which peaked at day 4 (n = 4/day ± SEM, performed in duplicate).
Figure 3.
Figure 3.
Detection of C3 mRNA by in situ hybridization (original magnification, ×1000). Day 2 syngeneic grafts showed dense staining of C3 mRNA in glomeruli (A) with a glomerular mesangial cell distribution (GM), and in smooth muscle cells of arterial vessel walls (B). A similar staining pattern was found in allogeneic organs at day 2 (not shown). In allografted kidneys at day 4, dense staining for C3 mRNA was found in glomerular parietal cells (C) of the Bowman’s capsule (GP), as well as tubule cells (T) and in some infiltrating cells (I), (D). In syngeneic kidneys at day 4 however (E), staining was very weak in glomeruli (G), tubules (T), and vessels (V), compared to allogeneic tissue and similar to that found in normal kidney (F). Negative controls were performed using sense probe on transplanted tissues. Representative negative control photomicrographs are shown for day 4 in allografts (G) and isografts (H) and showed low background staining.
Figure 4.
Figure 4.
The expression of pro-inflammatory cytokines by RT-PCR in transplanted kidneys. By RT-PCR, no IL-2 (A) or IFN-γ (B) gene expression was detected in normal (day 0) renal tissue or in syngeneic kidney transplants. In allogeneic grafts IL-2 gene expression peaked at day 3 post-transplant, whereas IFN-γ gene transcription was detected from day 3, peaking at day 4 post-transplant. Expression of TNF-α (C) and IL-1β (D) was detected in normal tissues and, although varied, did not increase significantly in isografted tissues by Student’s t-test at any day post-transplant. Expression for TNF-α and IL-1β did increase coincidentally with the peak of cell-mediated rejection at days 4 and 5 post-transplantation. The data are expressed as a percentage of β-actin gene expression by RT-PCR (n = 4/day ± SEM, performed in duplicate). mRNA expression in normal and isografted organs, - -▴- - ; mRNA expression in allografted tissu1s, - - ▪ - -.
Figure
Figure
Figure 5.
Figure 5.
The stimulation of C3 gene expression by PTEC using IL-2 and IFN-γ. Representative PCR bands of β-actin and C3 in cultured rat renal PTEC are shown after stimulation with IL-2 ( ) or IFN-γ (- - ▪ - -) that in transplanted tissues are derived from the infiltrating population of leukocytes. The graph shows the rapid up-regulation of C3 mRNA after IFN-γ stimulation, and the later effect of IL-2 on C3 mRNA expression. The data are expressed as a percentage of β-actin expression (experiments performed in triplicate, mean ± SEM).

References

    1. Erdei A, Fust G, Gergely J: The role of C3 in the immune response. Immunol Today 1991, 12:332-337 - PubMed
    1. Mathew M, Bolton WK: Linear C3 deposits on the tubular basement membrane in renal allograft biopsies. Am J Kidney Dis 1988, 12:121-125 - PubMed
    1. Feucht HE, Schneeberger H, Hillebrand G, Burkhardt K, Weiss M, Reithmuller G, Land W, Albert E: Capillary deposition of C4d complement fragment and early renal graft loss. Kidney Int 1993, 43:1333-1338 - PubMed
    1. Feucht HE, Felber E, Gokel MJ, Hillebrand G, Nattermann U, Brockmeyer C, Held E, Reithmuller G, Land W, Albert E: Vascular deposition of complement-split products in kidney allografts with cell-mediated rejection. Clin Exp Immunol 1991, 86:464-470 - PMC - PubMed
    1. Morgan BP, Gasque P: Extrahepatic complement biosynthesis: where, when and why? Clin Exp Immunol 1997, 107:1-7 - PMC - PubMed

MeSH terms