

doi: 10.1093/nar/28.18.3504.
H-NS mediated compaction of DNA visualised by atomic force microscopy
Affiliations
- PMID: 10982869
- PMCID: PMC110753
- DOI: 10.1093/nar/28.18.3504
Item in Clipboard
H-NS mediated compaction of DNA visualised by atomic force microscopy
Nucleic Acids Res.
.
Abstract
The Escherichia coli H-NS protein is a nucleoid-associated protein involved in gene regulation and DNA compaction. To get more insight into the mechanism of DNA compaction we applied atomic force microscopy (AFM) to study the structure of H-NS-DNA complexes. On circular DNA molecules two different levels of H-NS induced condensation were observed. H-NS induced lateral condensation of large regions of the plasmid. In addition, large globular structures were identified that incorporated a considerable amount of DNA. The formation of these globular structures appeared not to be dependent on any specific sequence. On the basis of the AFM images, a model for global condensation of the chromosomal DNA by H-NS is proposed.
Figures
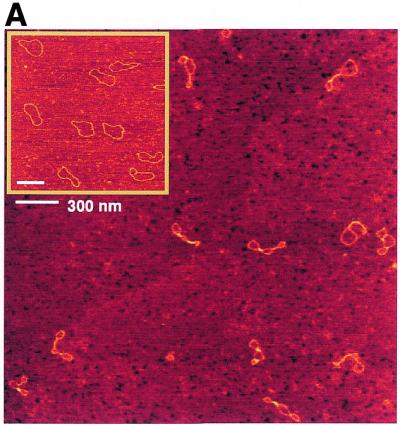
AFM images of circular nicked pUC19 molecules with and without H-NS. (A) DNA molecules after incubation with H-NS (1 dimer per 12 bp) on a 2.5 × 2.5 µm surface area and DNA molecules without H-NS on a 2 × 2 µm surface area (inset). (B) Close-up images of class I complexes. Complexes are laterally condensed and show a small reduction of DNA contour length (~3%). (C) Close-up images of class II complexes. Complexes show characteristic foci with a more dramatic level of condensation and a large reduction of DNA contour length (up to ~25%). All close-up images of condensed molecules show a 500 × 500 nm surface area. The colour scale ranges from 0.0 to 3.0 nm (from dark to bright).
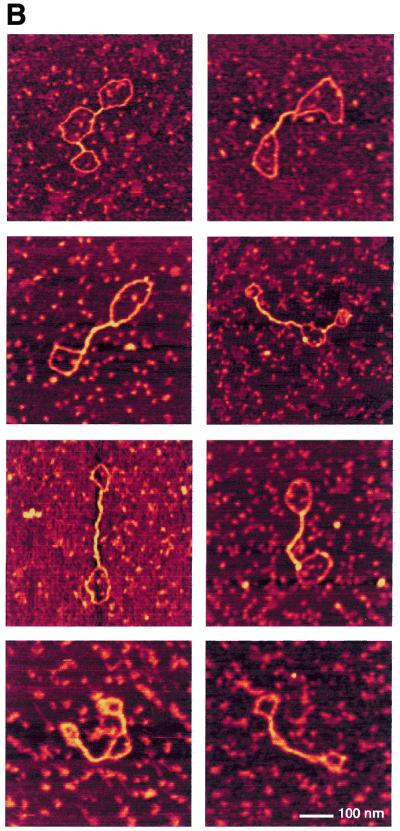
AFM images of circular nicked pUC19 molecules with and without H-NS. (A) DNA molecules after incubation with H-NS (1 dimer per 12 bp) on a 2.5 × 2.5 µm surface area and DNA molecules without H-NS on a 2 × 2 µm surface area (inset). (B) Close-up images of class I complexes. Complexes are laterally condensed and show a small reduction of DNA contour length (~3%). (C) Close-up images of class II complexes. Complexes show characteristic foci with a more dramatic level of condensation and a large reduction of DNA contour length (up to ~25%). All close-up images of condensed molecules show a 500 × 500 nm surface area. The colour scale ranges from 0.0 to 3.0 nm (from dark to bright).
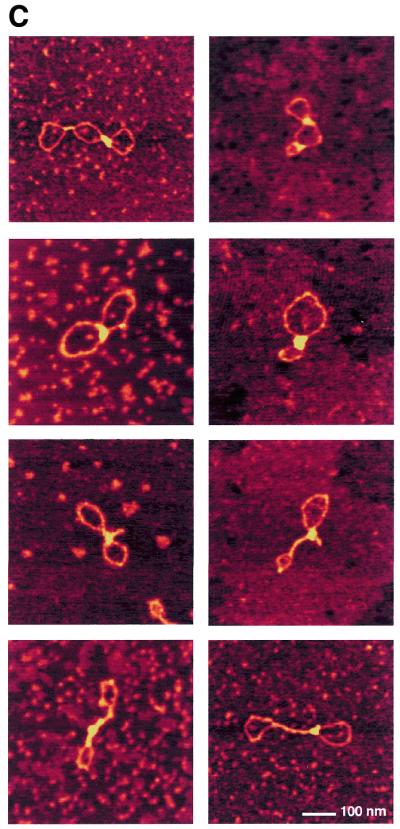
AFM images of circular nicked pUC19 molecules with and without H-NS. (A) DNA molecules after incubation with H-NS (1 dimer per 12 bp) on a 2.5 × 2.5 µm surface area and DNA molecules without H-NS on a 2 × 2 µm surface area (inset). (B) Close-up images of class I complexes. Complexes are laterally condensed and show a small reduction of DNA contour length (~3%). (C) Close-up images of class II complexes. Complexes show characteristic foci with a more dramatic level of condensation and a large reduction of DNA contour length (up to ~25%). All close-up images of condensed molecules show a 500 × 500 nm surface area. The colour scale ranges from 0.0 to 3.0 nm (from dark to bright).
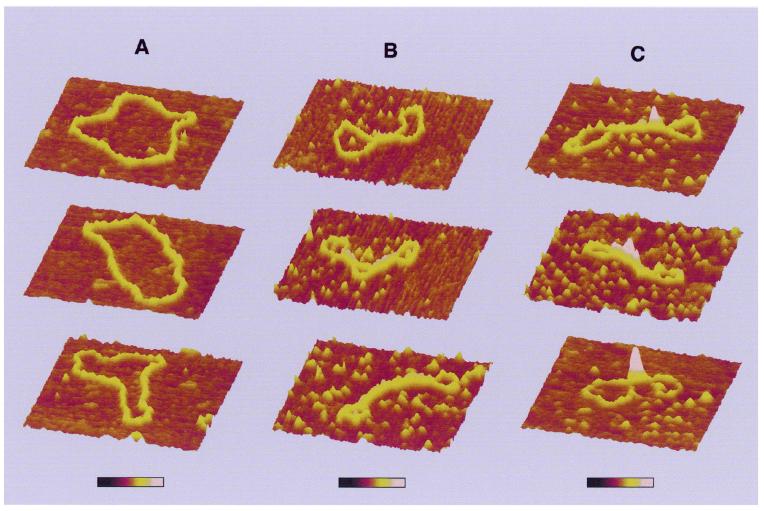
Three-dimensional representation of circular nicked pUC19 molecules with and without H-NS. (A) DNA molecules without H-NS. (B) Class I complexes. (C) Higher order condensed class II complexes. Each series of images corresponds to characteristic structures found in that class. All images show a 400 × 400 nm surface area. The colour bar indicates sample height and corresponds to a 0.0–3.0 nm range (from dark to bright).
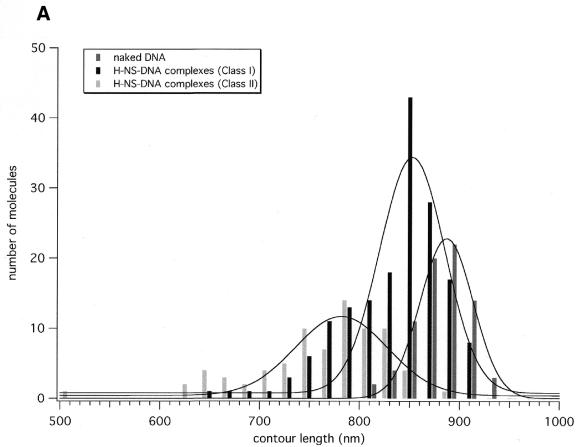
Histograms of measurements performed on H-NS–DNA complexes. (A) Apparent contour length of naked DNA molecules (n = 76) and H-NS–DNA complexes (n = 166 for class I complexes and n = 80 for class II complexes). (B) Global and local condensation factors as determined for H-NS–DNA complexes.
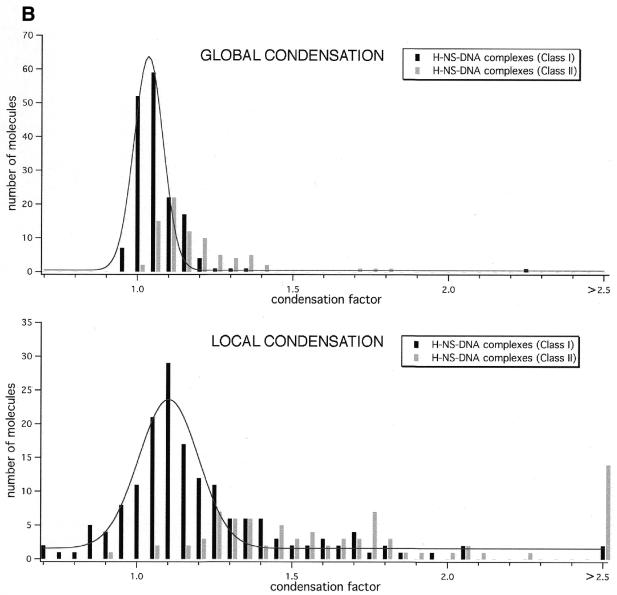
Histograms of measurements performed on H-NS–DNA complexes. (A) Apparent contour length of naked DNA molecules (n = 76) and H-NS–DNA complexes (n = 166 for class I complexes and n = 80 for class II complexes). (B) Global and local condensation factors as determined for H-NS–DNA complexes.
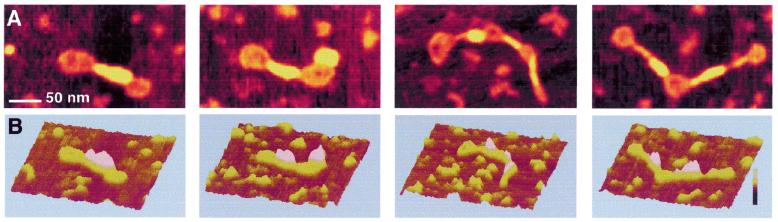
AFM images of circular nicked pUC19 molecules after incubation with H-NS (1 dimer per 6 bp). (A) Two-dimensional representation. Images show a 300 × 175 nm surface area. (B) Three-dimensional representation. Images show a 300 × 300 nm surface area. The colour bar indicates sample height and corresponds to a 0.0–3.0 nm range (from dark to bright).
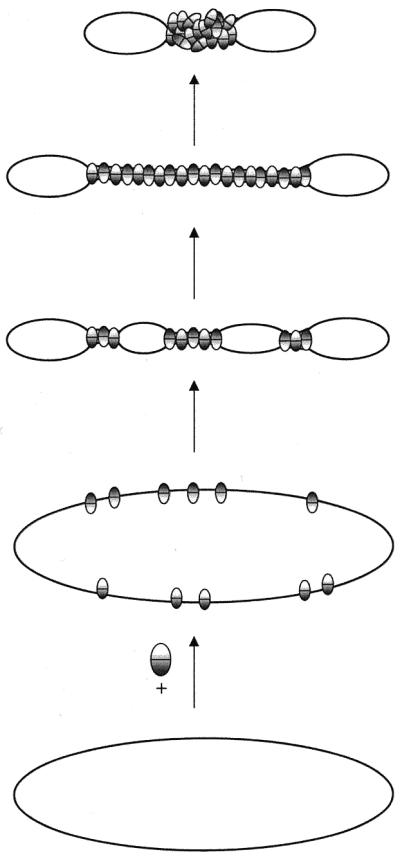
Model for DNA condensation induced by H-NS. When two DNA strands come close enough, the bound protein interacts with an additional DNA strand or protein bound to that strand forming an intramolecular bridge. The formation of the first bridges leads to an increased chance of further DNA bridging in the intervening free ‘bubbles’. Subsequently, further oligomerisation between the H-NS molecules bound in the lateral tracts leads to a second level of condensation. Split ovals represent an H-NS dimer or tetramer exposing at least two DNA binding domains.
References
-
- Jacquet M., Cukier-Kahn,R., Pla,J. and Gros,F. (1971) Biochem. Biophys. Res. Commun., 45, 1597–1607. - PubMed
-
- Goosen N. and van de Putte,P. (1995) Mol. Microbiol., 16, 1–7. - PubMed
-
- Finkel S.E. and Johnson,R.C. (1992) Mol. Microbiol., 6, 3257–3265. - PubMed
-
- Lucht J.M., Dersch,P., Kempf,B. and Bremer,E. (1994) J. Biol. Chem., 269, 6578. - PubMed
MeSH terms
Substances
LinkOut - more resources
Full Text Sources
Other Literature Sources
Molecular Biology Databases
Miscellaneous
