

New isotopic evidence for chronic lead contamination in the San Francisco Bay estuary system: implications for the persistence of past industrial lead emissions in the biosphere
- PMID: 10984502
- PMCID: PMC17174
- DOI: 10.1073/pnas.180125697
New isotopic evidence for chronic lead contamination in the San Francisco Bay estuary system: implications for the persistence of past industrial lead emissions in the biosphere
Abstract
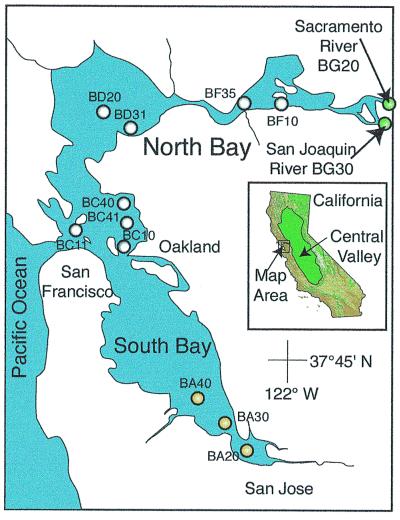
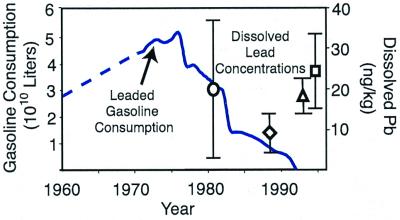
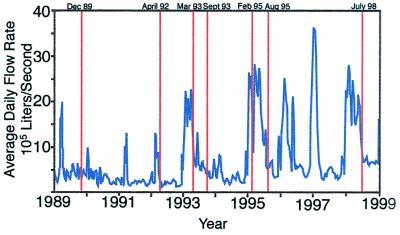
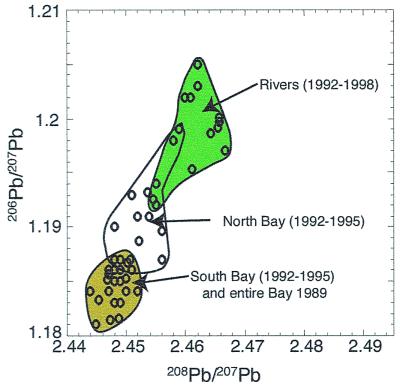
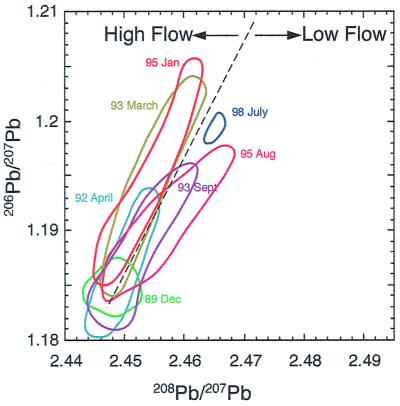
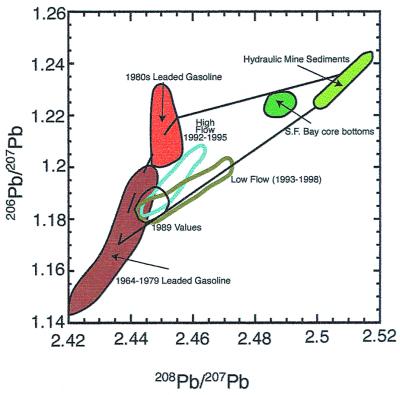
Measurements of lead isotope compositions in unfiltered San Francisco Bay waters from 1989 to 1998 have brought new insights into the cycling of anthropogenic lead in estuaries. Isotopic compositions of lead in the shallow (<2 m) southern reach were essentially invariant ( approximately 90% derived from 1960s-1970s leaded gasoline) during the study period because of limited hydraulic flushing and the remobilization of lead from bottom sediments. In contrast, in the northern reach freshwater flushing from the San Joaquin and Sacramento rivers produced seasonal and decadal variations in lead isotope compositions. The seasonal shifts are attributed to advection of soils containing late 1980s gasoline lead into the bay during winter rains. Mass balance calculations indicate that only a small fraction (1-10%) of this leaded gasoline fallout from the late 1980s has been washed out of the San Joaquin and Sacramento rivers' drainage basin by 1995. Superimposed on this seasonal cycling was a long-term systematic shift in the component of gasoline lead expressed in the river systems, with a small ( approximately 5-10%) decrease in the amount of 1960s-1970s gasoline lead in river and North Bay waters. The retention of gasoline lead in the river systems draining into the bay as well as San Francisco Bay sediments indicates that historic gasoline deposits may remain in the combined riparian/estuarine system for decades. Such a persistence is in contraindication to recent reports of rapid (annual) decreases in lead contamination in other environments, and the link between climate and contaminant transport suggests local or global climate change will have an impact on contaminant distribution and fate.
Figures
Similar articles
-
The slow recovery of San Francisco Bay from the legacy of organochlorine pesticides.Environ Res. 2007 Sep;105(1):87-100. doi: 10.1016/j.envres.2006.07.001. Epub 2006 Aug 23. Environ Res. 2007. PMID: 16930588
-
Decadal trends of silver and lead contamination in San Francisco Bay surface waters.Environ Sci Technol. 2002 Jun 1;36(11):2379-86. doi: 10.1021/es015746r. Environ Sci Technol. 2002. PMID: 12075793
-
A review of factors influencing measurements of decadal variations in metal contamination in San Francisco Bay, California.Ecotoxicology. 2005 Aug;14(6):645-60. doi: 10.1007/s10646-005-0016-6. Epub 2005 Oct 7. Ecotoxicology. 2005. PMID: 16215699 Review.
-
Declining-but persistent-atmospheric contamination in central California from the resuspension of historic leaded gasoline emissions as recorded in the lace lichen (Ramalina menziesii Taylor) from 1892 to 2006.Environ Sci Technol. 2010 Jul 15;44(14):5613-8. doi: 10.1021/es100246e. Environ Sci Technol. 2010. PMID: 20527766
-
Polychlorinated biphenyls (PCBs) in San Francisco Bay.Environ Res. 2007 Sep;105(1):67-86. doi: 10.1016/j.envres.2007.01.013. Epub 2007 Apr 23. Environ Res. 2007. PMID: 17451673 Review.
Cited by
-
Lead contamination in cocoa and cocoa products: isotopic evidence of global contamination.Environ Health Perspect. 2005 Oct;113(10):1344-8. doi: 10.1289/ehp.8009. Environ Health Perspect. 2005. PMID: 16203244 Free PMC article.
-
Assessment of the contribution of utility vault water to surface water pollution.Environ Monit Assess. 2019 Jun 26;191(7):467. doi: 10.1007/s10661-019-7585-y. Environ Monit Assess. 2019. PMID: 31243605 Free PMC article.
-
Trace metal inventories and lead isotopic composition chronicle a forest fire's remobilization of industrial contaminants deposited in the angeles national forest.PLoS One. 2014 Sep 26;9(9):e107835. doi: 10.1371/journal.pone.0107835. eCollection 2014. PLoS One. 2014. PMID: 25259524 Free PMC article.
-
Return of naturally sourced Pb to Atlantic surface waters.Nat Commun. 2016 Sep 28;7:12921. doi: 10.1038/ncomms12921. Nat Commun. 2016. PMID: 27678297 Free PMC article.
-
Strong evidence for the continued contribution of lead deposited during the 20th century to the atmospheric environment in London of today.Proc Natl Acad Sci U S A. 2021 Jun 29;118(26):e2102791118. doi: 10.1073/pnas.2102791118. Proc Natl Acad Sci U S A. 2021. PMID: 34155116 Free PMC article.
References
-
- Volkening J, Heumann K G. J Geophys Res Atmos. 1990;95:20623–20632.
-
- Veron A J, Church T M, Flegal A R. Environ Res. 1998;78:104–111. - PubMed
-
- Helmers E, Schrems O. Atmos Environ. 1995;29:2475–2484.
-
- Hong S M, Boutron C F, Edwards R, Morgan V I. Environ Res. 1998;78:94–103. - PubMed
-
- Boutron C F, Gorlach U, Candelone J P, Bolshov M A, Delmas R J. Nature (London) 1991;353:153–156.
Publication types
MeSH terms
Substances
LinkOut - more resources
Full Text Sources
Miscellaneous
