

Folding simulations of a three-stranded antiparallel beta -sheet peptide
- PMID: 10984515
- PMCID: PMC27100
- DOI: 10.1073/pnas.190324897
Folding simulations of a three-stranded antiparallel beta -sheet peptide
Abstract
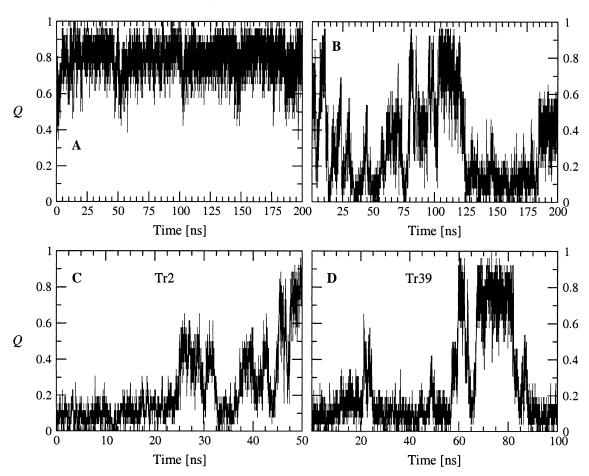
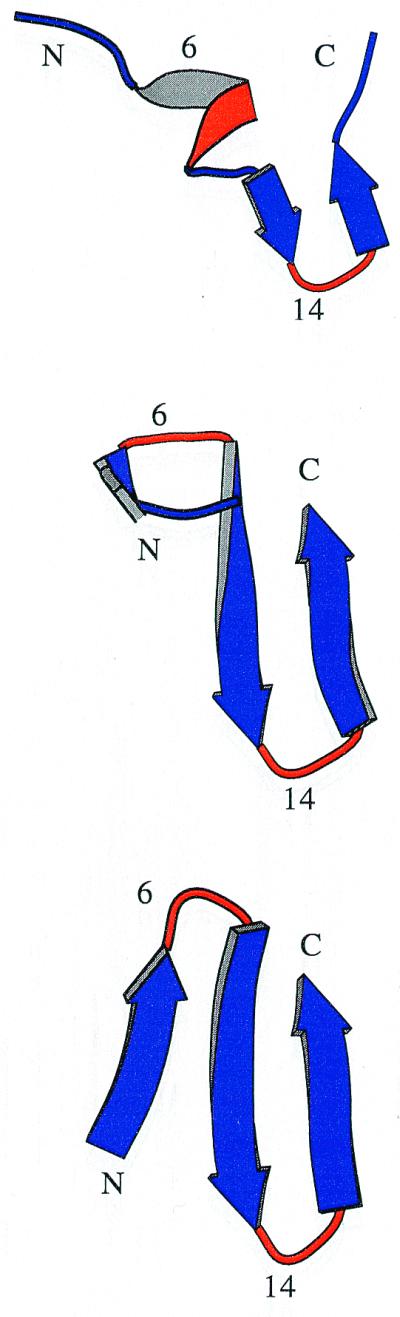
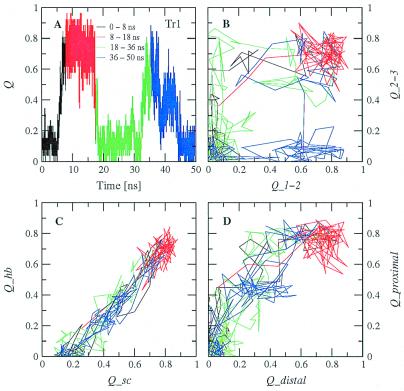
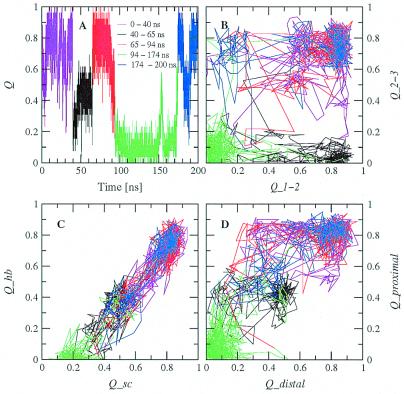
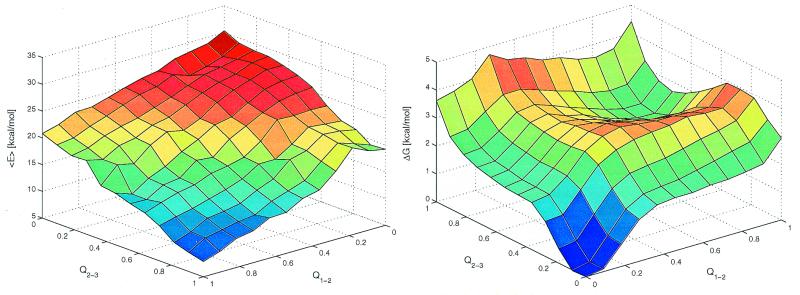
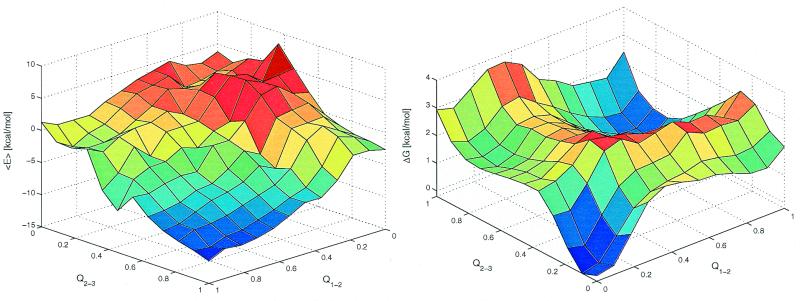
Protein folding is a grand challenge of the postgenomic era. In this paper, 58 folding events sampled during 47 molecular dynamics trajectories for a total simulation time of more than 4 micros provide an atomic detail picture of the folding of a 20-residue synthetic peptide with a stable three-stranded antiparallel beta-sheet fold. The simulations successfully reproduce the NMR solution conformation, irrespective of the starting structure. The sampling of the conformational space is sufficient to determine the free energy surface and localize the minima and transition states. The statistically predominant folding pathway involves the formation of contacts between strands 2 and 3, starting with the side chains close to the turn, followed by association of the N-terminal strand onto the preformed 2-3 beta-hairpin. The folding mechanism presented here, formation of a beta-hairpin followed by consolidation, is in agreement with a computational study of the free energy surface of another synthetic three-stranded antiparallel beta-sheet by Bursulaya and Brooks [(1999) J. Am. Chem. Soc. 121, 9947-9951]. Hence, it might hold in general for antiparallel beta-sheets with short turns.
Figures
Similar articles
-
Native topology or specific interactions: what is more important for protein folding?J Mol Biol. 2001 Mar 2;306(4):837-50. doi: 10.1006/jmbi.2000.4400. J Mol Biol. 2001. PMID: 11243792
-
Folding pathways and rates for the three-stranded beta-sheet peptide Beta3s using discrete path sampling.J Phys Chem B. 2008 Jul 24;112(29):8760-9. doi: 10.1021/jp801777p. Epub 2008 Jun 28. J Phys Chem B. 2008. PMID: 18588333
-
Cooperative folding mechanism of a beta-hairpin peptide studied by a multicanonical replica-exchange molecular dynamics simulation.Proteins. 2007 Mar 1;66(4):846-59. doi: 10.1002/prot.21264. Proteins. 2007. PMID: 17173285
-
De novo design of monomeric beta-hairpin and beta-sheet peptides.Methods Mol Biol. 2006;340:27-51. doi: 10.1385/1-59745-116-9:27. Methods Mol Biol. 2006. PMID: 16957331 Review.
-
Network and graph analyses of folding free energy surfaces.Curr Opin Struct Biol. 2006 Feb;16(1):71-8. doi: 10.1016/j.sbi.2006.01.002. Epub 2006 Jan 18. Curr Opin Struct Biol. 2006. PMID: 16413772 Review.
Cited by
-
Net charge changes in the calculation of relative ligand-binding free energies via classical atomistic molecular dynamics simulation.J Comput Chem. 2014 Jan 30;35(3):227-43. doi: 10.1002/jcc.23490. Epub 2013 Nov 19. J Comput Chem. 2014. PMID: 24249099 Free PMC article.
-
Review of the fundamental theories behind small angle X-ray scattering, molecular dynamics simulations, and relevant integrated application.Nano Rev. 2015 Feb 25;6:25661. doi: 10.3402/nano.v6.25661. eCollection 2015. Nano Rev. 2015. PMID: 25721341 Free PMC article.
-
beta-Strand interactions at the domain interface critical for the stability of human lens gammaD-crystallin.Protein Sci. 2010 Jan;19(1):131-40. doi: 10.1002/pro.296. Protein Sci. 2010. PMID: 19937657 Free PMC article.
-
Folding mechanisms of individual beta-hairpins in a Go model of Pin1 WW domain by all-atom molecular dynamics simulations.J Chem Phys. 2008 Jun 14;128(22):225103. doi: 10.1063/1.2936832. J Chem Phys. 2008. PMID: 18554060 Free PMC article.
-
Transition states in protein folding kinetics: modeling phi-values of small beta-sheet proteins.Biophys J. 2008 Feb 1;94(3):929-37. doi: 10.1529/biophysj.107.109868. Epub 2007 Sep 28. Biophys J. 2008. PMID: 17905840 Free PMC article.
References
-
- Dobson C M, Karplus M. Curr Opin Struct Biol. 1999;9:92–101. - PubMed
-
- Lacroix E, Kortemme T, de la Paz M, Serrano L. Curr Opin Struct Biol. 1999;9:487–493. - PubMed
-
- Imperiali B, Ottesen J. J Peptide Res. 1999;54:177–184. - PubMed
-
- Crane J C, Koepf E K, Kelly J, Gruebele M. J Mol Biol. 2000;298:283–292. - PubMed
-
- Duan Y, Kollman P A. Science. 1998;282:740–744. - PubMed
Publication types
MeSH terms
Substances
LinkOut - more resources
Full Text Sources
