

Identification of diverse nerve growth factor-regulated genes by serial analysis of gene expression (SAGE) profiling
- PMID: 10984536
- PMCID: PMC27040
- DOI: 10.1073/pnas.97.19.10424
Identification of diverse nerve growth factor-regulated genes by serial analysis of gene expression (SAGE) profiling
Abstract
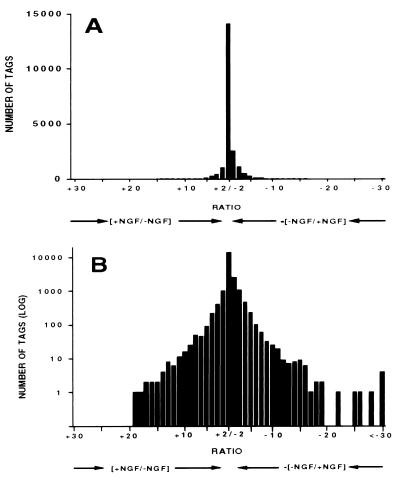
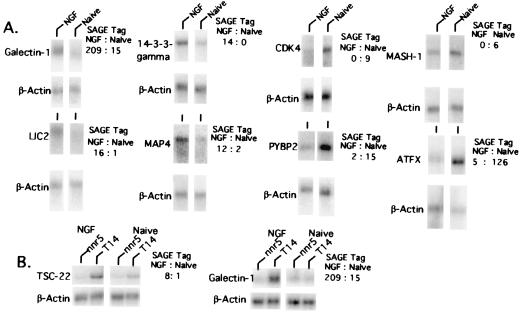
Neurotrophic factors such as nerve growth factor (NGF) promote a wide variety of responses in neurons, including differentiation, survival, plasticity, and repair. Such actions often require changes in gene expression. To identify the regulated genes and thereby to more fully understand the NGF mechanism, we carried out serial analysis of gene expression (SAGE) profiling of transcripts derived from rat PC12 cells before and after NGF-promoted neuronal differentiation. Multiple criteria supported the reliability of the profile. Approximately 157,000 SAGE tags were analyzed, representing at least 21,000 unique transcripts. Of these, nearly 800 were regulated by 6-fold or more in response to NGF. Approximately 150 of the regulated transcripts have been matched to named genes, the majority of which were not previously known to be NGF-responsive. Functional categorization of the regulated genes provides insight into the complex, integrated mechanism by which NGF promotes its multiple actions. It is anticipated that as genomic sequence information accrues the data derived here will continue to provide information about neurotrophic factor mechanisms.
Figures
References
Publication types
MeSH terms
Substances
LinkOut - more resources
Full Text Sources
Other Literature Sources
