Comparative Study
. 1975 Sep;37(3):359-78.
doi: 10.1161/01.res.37.3.359.

Myocardial sodium extraction at varied coronary flows in the dog. Estimation of capillary permeability of residue and outflow detection

Comparative Study

Myocardial sodium extraction at varied coronary flows in the dog. Estimation of capillary permeability of residue and outflow detection

B Guller et al. Circ Res. 1975 Sep.

Abstract

Sudden injections of boluses containing both 131I-albumin and 24NaCl were made into the coronary artery inflow of isolated blood-perfused dog hearts. Indicator dilution curves were recorded using gamma emissions from both the intact heart and the coronary sinus outflow, with plasma flows, Fs, ranging from 0.3 to 1.8 ml/g min-1. Three measures of sodium extraction, E, during transcapillary passage were obtained from each site by comparison of the sodium and albumin curves. The most useful estimates of E were "instantaneous extractions" obtained from the later part of the upslope and the peak of the venous dilution curves (coronary sinus) or from the corresponding early phase of washout of the externally monitored curves (intact organ). Extractions were lower at higher flows. Permeability-surface area products, PS, were computed (1) by the formula PS equals -Fsloge(1 - E), (2) by fitting the observed dilution curves with a Krogh capillary-tissue cylinder model, and (3) by the approximating formula PS equals -Fsloge (1 - 1.14E). The two latter approaches provided a correction for back diffusion of tracer from tissue to blood. For sodium, the values of PS averaged 0.88 +/- 0.36 (SD) ml/g min-1, (n equals 52). At high flows, with Fs greater than 1.0 ml/g min-1, the values of PS averaged 1.01 +/- 0.38 ml/g min-1 (N equals 11). Assuming S equals 500 cm2/g and plasma to be 93% water, our findings suggest capillary permeabilities for sodium of about 3.1 times 10(-5) cm/sec.


Figures

FIGURE 1
FIGURE 1
Methods of estimating extractions. E. Broken lines = diffusible indicator (subscript D) and solid lines = reference indicator (subscript N). Left: The transport function, hD(t), the probability density function of arrival times of the permeating tracer at the outflow, consists of an intravascular component which has a shape similar to the transport function for a nonpermeating reference tracer, hN(t), and a temporally separated second component representing tracer which enters the tissue, later returns to the blood, and is washed out. The basic definitions for the net extraction, E1 the instantaneous extraction E2, and the area-weighted mean extraction, E3, are given; all haue similar maximums when the extravascular component returns very late, starting at 16 seconds in the diagram. Right: The normal situation is that the two components overlap; the back diffusion of the extracted component begins at about 2 seconds and has a shape identical to that in the left of the figure. In this case, E1M (E1VM or E1HM) is less than E2M or E3M. The residue function, R(t), is 10th(τ)dτ, where the integral represents the fraction of injected indicator still remaining in the organ at time t. By using a brief injection of a gamma-emitting isotope, R(t) can be obtained by placing a gamma detector close to the organ. In this figure and in subsequent illustrations, negative values of E(t) are not plotted. The diagram is oversimplified in that E2 and E3 are identical in the first seconds, which only occurs so long as E2(t) is constant.
FIGURE 2
FIGURE 2
Experimental setup for the detection of tracer clearance from the isolated blood-perfused heart. Nal-crystal gamma detectors recorded emissions from the heart itself (LV crystal) for RN(i) and RD(t) and from the venous outflow for hN(t) and hN(t): the coronary sinus blood passed through the cannula in the pulmonary artery. PA, leading to the detection site (Venous crystal).
FIGURE 3
FIGURE 3
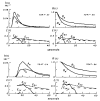
Concentration-time curves of 2Na (labeled D, diffusible) and 131I-albumin (labeled N, nonpermeating) were recorded by continuous detection over the venous outflow (labeled V. normalized to give h[t], left) and simultaneously over the heart (labeled H and normalized to R[t], right) at two different flows, FS = 1.23 ml/g min−1 (top groups) or Fs = 0.48 ml/g min−1 (bottom groups). The six forms of E(t), given in the bottom sections of each group show the relationships expected from Figure 1. The residue functions provide slightly better temporal resolution (the tail of E2H diminishes faster than that of E2V). Experiment numbers are the same as they are in Table 2. Count accumulation intervals were I second in the top groups and 2 seconds in the bottom groups.
FIGURE 4
FIGURE 4
Extractions, E2V(t), for sodium in the venous outflow at various plasma flows, Fs. At high flow, transit times were short. Lower flows resulted in larger extractions, as might be expected from longer transcapillary transport time or contact time. At all flows, early extractions were low, and the maximum extraction occurred a few seconds later near the time of the peak of hN(t) (tp is indicated by arrows) at moderate or high flows or earlier at low flows. One line is broken to distinguish it from its neighbors (experiment 7047).
FIGURE 5
FIGURE 5
Comparisons of the maximum of E2V(t) with the maximums, EIVM, E3VM, and E2HM. Values of E1VM underestimated E2VM. E2VM differed little from E2HM or E3VM. Straight lines are lines of identity. Symbols are the same as they are in Table 2.
FIGURE 6
FIGURE 6
Venous outflow dilution curves fitted by the Krogh model solutions for two hearts. The experimental albumin curve. hN(t). is used as input to the model. The experimental sodium curve. hD(t), is the dotted line. The observed extraction. E2V(t) (crosses) is approximated by the model solution {broken line). The experiment numbers are given in the top right corners; the experimental data and the Krogh model parameters for the fitting are given in Table 2. Note the difference in extractions at similar flows in these two hearts. The dash-dot line gives the shape of hD(t) that would be obtained in the absence of back diffusion (as with VE = ∞) and whose maximum would be used for PS calculation by the Crone equation (Eq. 1).
FIGURE 7
FIGURE 7
Development of an empirical relationship to simplify the estimation of PS/Fs from the instantaneous extraction. Left: E′2V(tp) values from the solutions of the model fitted to experimental curves, as in Figure 6, are plotted versus the PS′/Fs estimates provided by the model fit. The smooth lines constitute a set of model solutions with different V′E values. The set was chosen from among a family of sets having different degrees of curvature and deviation from Eq. 1. the straight line of no back diffusion; in the chosen set, a V′E of 0.20 or 0.25 ml/g gave appropriate curvature and position close to the observed points. The curve of best fit is that with a V′E of 0.21 ml/g. Symbols are the same as they are in Table 2. {The curves were generated for variable P, with constant values for S [590 cm2/g] and for the volume of intracapillary solute space [0.044 ml/g ].) Right: From the curve for V′E = 0.21 ml/g, various constant values were subtracted from 1 − E2V(tp); the value 0.12 was empirically found to produce the nearly straight continuous curve labeled “Model curve for V′E = 0.21.” The broken straight line parallel to the line for V′E = ∞ was drawn through this subtracted curve; the goodness of fit to the original curve is demonstrated by adding the constant, 0.12, to this straight line to produce the broken upper curved line, PS/Fs = − logp [1 − 1.14E2V(tP)], which fits the model curve for V′E = 0.21 closely. The values for PS (graph), columns 18 and 19 of Table 2 and Figure 8, were obtained using this line. (This technique of obtaining the best approximating exponential relationship was originally devised for describing the light absorption curve for indocyanine green dye in blood which deviated from a Beer's Law relationship much as the continuous line for V′E = 0.21 deviates from the straight line for V′E = ∞ [34, 35].)
FIGURE 8
FIGURE 8
Effect of flow on PS for sodium. The PS values are PS(graph) taken from columns 18 and 19 of Table 2 or the average PS(graph) when both E2VM and E2HM were obtained experimentally. Symbols are defined in Table 2. The increase at high flows presumably reflects an increase in surface area via recruitment of capillaries which were not functioning at lower flows. The increases in PS can in some instances be attributed in part to the use of vasodilators which, as indicated in Table 2, were used primarily at high flows.
FIGURE 9
FIGURE 9
Clearance, E·Fs, as a function of flow, Fs. The line of identity (solid line with PS = ∞) indicates flow-limited washout for which local blood-tissue equilibration is essentially instantaneous. The solid lines are given by the equation PS = −Fslogp (1 – E2VM) for the ideal situation in which no back diffusion occurs. The broken lines are given by Eq. 7, PS = −Fslogp (1–1.14 E2VM). The symbols for the experimental data points are defined in Table 2.

References

    1. Crone C. Permeability of capillaries in various organs as determined by use of the “indicator diffusion” method. Acta Physiol Scand. 1963;58:292–305. - PubMed
    1. Zierler KL. Theory of use of indicators to measure blood flow and extracellular volume and calculation of transcapillary movement of tracers. Circ Res. 1963;12:464–471.
    1. Lassen NA, Crone C. Extraction fraction of a capillary bed to hydrophilic molecules: Theoretical considerations regarding the single injection technique with a discussion of the role of diffusion between laminar streams (Taylor's effect) In: Crone C, Lassen NA, editors. Capillary Permeability. Copenhagen; Munksgaard: 1970. pp. 48–59.
    1. Yudilevich DL, Martin de Julián P. Potassium, sodium, and iodide transcapillary exchange in dog heart. Am J Physiol. 1965;208:959–967. - PubMed
    1. Bassingthwaighte JB. Concurrent flow model for extraction during transcapillary passage. Circ Res. 1974;35:483–503. - PMC - PubMed

Publication types