. 2000 Sep 15;19(18):4986-96.
doi: 10.1093/emboj/19.18.4986.

Activation of the beta globin locus by transcription factors and chromatin modifiers

Affiliations

Activation of the beta globin locus by transcription factors and chromatin modifiers

T McMorrow et al. EMBO J. .

Abstract

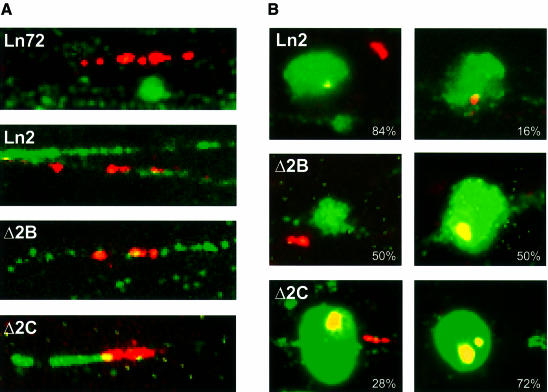
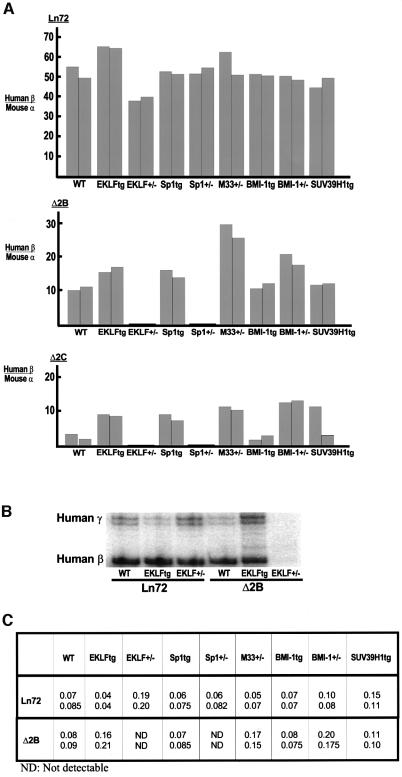
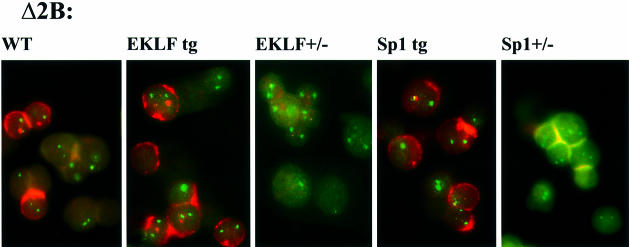
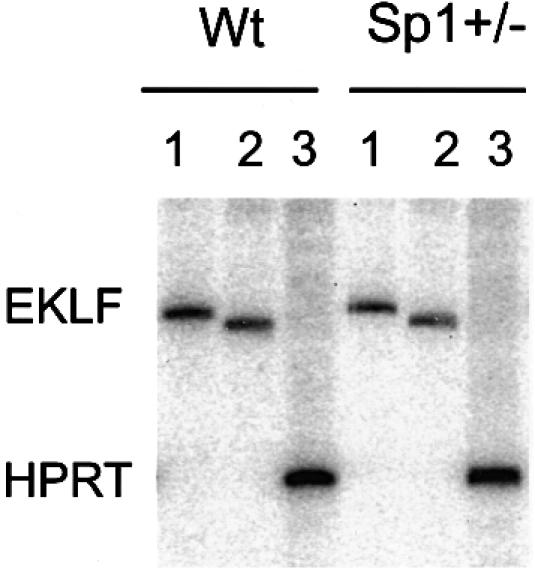
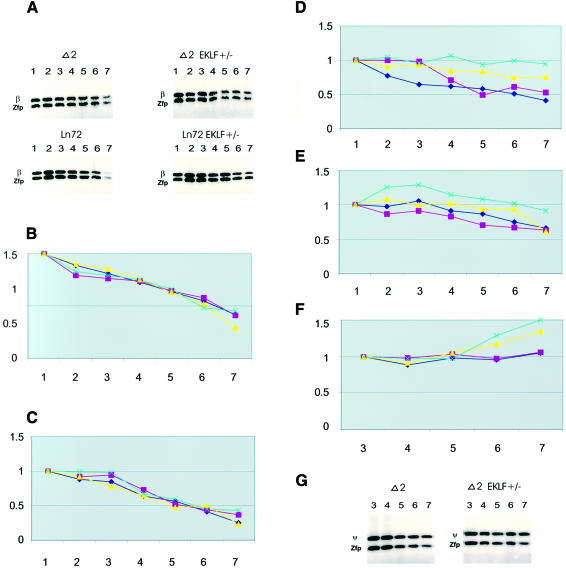
Locus control regions (LCRs) alleviate chromatin-mediated transcriptional repression. Incomplete LCRs partially lose this property when integrated in transcriptionally restrictive genomic regions such as centromeres. This frequently results in position effect variegation (PEV), i.e. the suppression of expression in a proportion of the cells. Here we show that this PEV is influenced by the heterochromatic protein SUV39H1 and by the Polycomb group proteins M33 and BMI-1. A concentration variation of these proteins modulates the proportion of cells expressing human globins in a locus-dependent manner. Similarly, the transcription factors Sp1 or erythroid Krüppel-like factor (EKLF) also influence PEV, characterized by a change in the number of expressing cells and the chromatin structure of the locus. However, in contrast to results obtained in a euchromatic locus, EKLF influences the expression of the gamma- more than the beta-globin genes, suggesting that the relief of silencing is caused by the binding of EKLF to the LCR and that genes at an LCR proximal position are more likely to be in an open chromatin state than genes at a distal position.


Figures

None
Fig. 1. (A) Representative examples of stretched chromatin fibres obtained by Fibre-FISH. The different lines used in this study have been tested to visualize the proximity of the transgene to the centromeric γ satellite repeats. The human globin transgene is detected in red and the γ satellite repeats in green. (B) Examples of partially stretched chromatin. In these instances centromeric γ satellite repeats remain in tight conformation, which is reminiscent of centromeric conformations (as observed by DAPI staining; data not shown). The γ satellite repeats and human β globin locus double detection reveals the relative position of the locus versus the centromere. The percentage of co-localization of the locus and the γ satellite repeats is indicated for each transgenic line (it should be noted that this is a two-dimensional analysis, i.e. the actual number of co-localizations is smaller).
None
Fig. 2. (A) Histograms of the S1 nuclease protection assays. The percentage of human β globin RNA was compared with the mouse α globin RNA in 14.5 day fetal livers. For each cross, the S1 nuclease protection was carried out on at least two fetal livers. The level of human β globin transcription was determined for each of the lines 72, Δ2B and Δ2C after crossing to different background mice. WT, wild-type background (B10/CBA); EKLFtg, overexpressed EKLF background; EKLF+/–, EKLF heterozygote knockout background; Sp1tg, overexpressed Sp1 background; Sp1+/–, Sp1 heterozygote knockout background; M33+/–, M33 heterozygote knockout background; BMI-1tg, overexpressed BMI-1 background; BMI-1+/–, BMI-1 heterozygote knockout background; SUV39H1tg, overexpressed SUV39H1 background. (B) S1 nuclease protection assay. The expression of the human γ genes was compared with the human β globin gene in 14.5 day fetal livers where the control transgenic line 72 and the PEV line Δ2B were in wild-type background (WT), in overexpressed EKLF background (EKLFtg), and in EKLF heterozygote knockout background (EKLF+/–). Note that the amount of RNA loaded on the gel has been adjusted to obtain the same β globin signal in each lane. (C) Ratio of human γ globin expression compared with human β globin expression in 14.5 day fetal livers obtained by S1 nuclease protection assay. For each cross, RNA from two different fetal livers was tested.
None
Fig. 3. Representative examples of Δ2B RNA-FISH detection. The mouse α globin transcripts are detected by FITC (green fluorescence) and the human β globin gene primary transcripts and mRNA are detected by texas-Red (red fluorescence). Δ2B in wild-type background, EKLF transgenic background, EKLF+/– background, Sp1 transgenic background, and in Sp1+/– background.
None
Fig. 4. Semi-quantitative RT–PCR analysis on RNA of wild-type (Wt) and Sp1+/– 14.5 day embyros as described previously (Marin et al., 1997). Primer combinations used are as follows: lane 1 = 5′-EKLF region (forward 5′-CCCTTCCGGAGAGGACGAT-3′; reverse 5′-CCTATGGGCTGCTGTCGGGATAC-3′); lane 2 = 3′-EKLF region (forward 5′-GGCTTGTCCCCGGGAACTGCG-3′; reverse 5′-ACCTAAGAGGCAGGCGGC-3′); and lane 3 = HPRT control (Marin et al., 1997).
None
Fig. 5. DNase I accessibility verified by DNase I-PCR method. Y-axis: an increase in the relative amount of PCR product (normalized to Zfp37 for each DNase I concentration), reflects a decrease in DNase I sensitivity; X-axis: increasing DNase I concentration (see Materials and methods). For all PCR product sizes see Materials and methods. (A) The limit PCR product series of the human β globin promoter relative to the Zfp37 promoter. The β globin product is 163 bp, the Zfp product is 149 bp. (B) Zfp37 promoter region (note that the Y-axis in this and following plots represents the amount of PCR product relative to the amount of Zfp37 PCR product at the lowest DNase I concentration). (C) Mouse β major promoter region relative to Zfp37, the mouse β globin PCR fragment (see Materials and methods). (D) Human β globin promoter region. (E) Human δ globin gene promoter. (F and G) The ψβ region of the human locus (only the high DNase concentrations are shown). The black lines represent the DNase I sensitivity of the different regions of the mouse or human loci in line 72 wild type; in red are the results for line 72 EKLF+/–; in yellow are the results for Δ2B wild type; in blue are the results for Δ2B EKLF+/–.

Similar articles

Cited by

References

    1. Aagaard L. et al. (1999) Functional mammalian homologues of the Drosophila PEV-modifier Su(var)3-9 encode centromere-associated proteins which complex with the heterochromatin component M31. EMBO J., 18, 1923–1938. - PMC - PubMed
    1. Aagaard L., Schmid,M., Warburton,P. and Jenuwein,T. (2000) Mitotic phosphorylation of SUV39H1, a novel component of active centromeres, coincides with transient accumulation at mammalian centromeres. J. Cell Sci., 113, 817–829. - PubMed
    1. Alami R., Greally,J.M., Tanimoto,K., Hwang,S., Feng,Y.Q., Engel,J.D., Fiering,S. and Bouhassira,E.E. (2000) β-globin YAC transgenes exhibit uniform expression levels but position effect variegation in mice. Hum. Mol. Genet., 9, 631–636. - PubMed
    1. Alkema M.J., van der Lugt,N.M.T., Bobeldijk,R.C., Berns,A. and van Lohuizen,M. (1995) Transformation of axial skeleton due to overexpression of bmi-1 in transgenic mice. Nature, 374, 724–727. - PubMed
    1. Aparicio O.M. and Gottschling,D.E. (1994) Overcoming telomeric silencing: a trans-activator competes to establish gene expression in a cell cycle-dependent way. Genes Dev., 8, 1133–1146. - PubMed

Publication types

MeSH terms

Substances