Clinical Trial
. 2000 Sep 15;527 Pt 3(Pt 3):623-31.
doi: 10.1111/j.1469-7793.2000.00623.x.

Cortico-muscular synchronization during isometric muscle contraction in humans as revealed by magnetoencephalography

Affiliations
Clinical Trial

Cortico-muscular synchronization during isometric muscle contraction in humans as revealed by magnetoencephalography

J Gross et al. J Physiol. .

Abstract

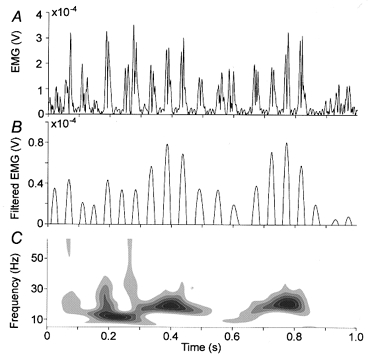
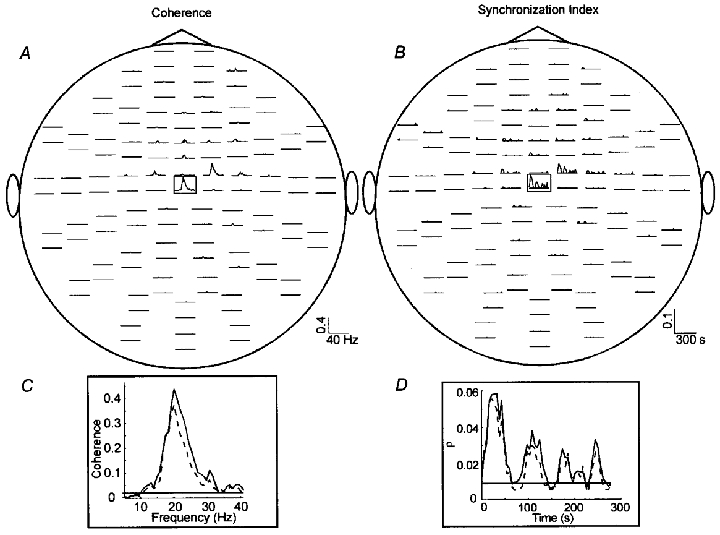
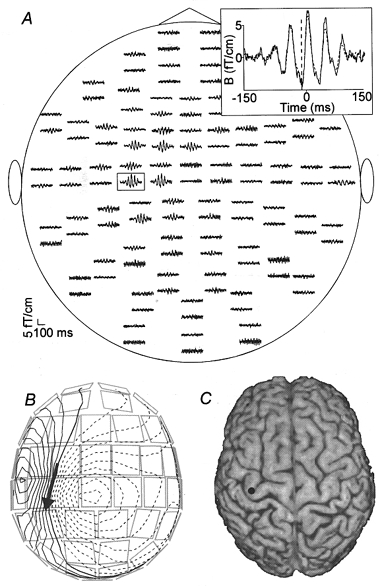
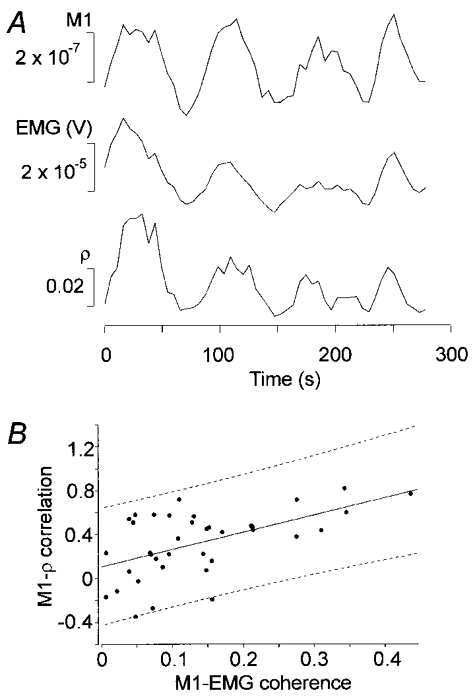
Magnetoencephalographic (MEG) and electromyographic (EMG) signals were recorded from six subjects during isometric contraction of four different muscles. Cortical sources were located from the MEG signal which was averaged time-locked to the onset of motor unit potentials. A spatial filtering algorithm was used to estimate the source activity. Sources were found in the primary motor cortex (M1) contralateral to the contracted muscle. Significant coherence between rectified EMG and M1 activity was seen in the 20 Hz frequency range in all subjects. Interactions between the motor cortex and spinal motoneuron pool were investigated by separately studying the non-stationary phase and amplitude dynamics of M1 and EMG signals. Delays between M1 and EMG signals, computed from their phase difference, were found to be in agreement with conduction times from the primary motor cortex to the respective muscle. The time-dependent cortico-muscular phase synchronization was found to be correlated with the time course of both M1 and EMG signals. The findings demonstrate that the coupling between the primary motor cortex and motoneuron pool is at least partly due to phase synchronization of 20 Hz oscillations which varies over time. Furthermore, the consistent phase lag between M1 and EMG signals, compatible with conduction time between M1 and the respective muscle with the M1 activity preceding EMG activity, supports the conjecture that the motor cortex drives the motoneuron pool.


Figures

Figure 1
Figure 1. An arbitrary 1 s segment of rectified EMG recorded from the left tibialis anterior muscle before (A) and after (B) filtering with a bandpass of 17–23 Hz
For the sake of clarity just the positive part of the filtered signal is shown in B. C, scalogram of the signal shown in A. This time–frequency representation is based on Morlet wavelets and displays the distribution of power in the time–frequency plane (Auger et al. 1999).
Figure 2
Figure 2. Coherence and synchronization index ρ between EMG and MEG signals
Coherence as function of frequency (A) and ρ as function of time (B) between rectified EMG recorded from the left tibialis anterior muscle and all MEG signals. Only values exceeding the 99% confidence level are shown. The sensor array is viewed from above. Traces are plotted in pairs corresponding to the two orthogonal planar gradiometers at each sensor location. C, coherence as function of frequency between EMG and M1 (continuous line) and between EMG and the MEG signal with the highest coherence (dashed line). D, ρ as function of time between EMG and M1 (continuous line) and between EMG and the MEG signal with the highest coherence (dashed line). The horizontal lines in Cand Dmark the 99% confidence level.
Figure 3
Figure 3. Averaged MEG signals timelocked to the onsets of the motor unit potentials of the right extensor indicis muscle
A, unfiltered averaged MEG signals timelocked to onsets of the motor unit potentials (phase-triggered average). The channels are arranged in the same way as in Fig. 2 (viewed from the top). The dashed vertical line at −15 ms in the inset marks the minimum in the signal and the dashed trace shows the part of the signal that is accounted for by the dipole. B, the isocontour map of the estimated magnetic field component normal to the sensor surface at −15 ms. The contour lines are separated by 0.2 fT. The arrow represents the dipole that explains the magnetic field best in the least-squares sense. C, the dipole superimposed on the subject's brain.
Figure 4
Figure 4
A, amplitudes of M1 activation and rectified EMG, and the synchronization index ρ as a function of time. All traces show mean values in a 20 s window moving across the signal in 5 s steps. B shows the dependence of the M1–ρ correlation on the M1–EMG coherence, together with the linear fit with the 95% confidence region (r2 = 0.30 and P < 0.0005).

References

    1. Ahonen AI, Hämäläinen MS, Kajola MJ, Knuutila JET, Laine PP, Lounasmaa OV, Parkkonen LT, Simola JT, Tesche CD. 122-channel SQUID instrument for investigating the magnetic signals from the human brain. Physica Scripta. 1993;49:198–205.
    1. Auger F, Flandrin P, Goncalves P, Lemoine O. Time Frequency Toolbox. France: CNRS, Rice University, USA; 1999.
    1. Baker SN, Kilner JM, Pinches EM, Lemon RN. The role of synchrony and oscillations in the motor output. Experimental Brain Research. 1999;128:109–117. - PubMed
    1. Baker SN, Olivier E, Lemon RN. Coherent oscillations in monkey motor cortex and hand muscle EMG show task-dependent modulation. The Journal of Physiology. 1997;501:225–241. - PMC - PubMed
    1. Brown P, Farmer SF, Halliday DM, Marsden J, Rosenberg JR. Coherent cortical and muscle discharge in cortical myoclonus. Brain. 1999;122:461–472. - PubMed

Publication types

LinkOut - more resources