. 2000 Apr-Dec;57(2-4):152-69.
doi: 10.1159/000028469.

Modeling and perception of 'gesture reduction'

Affiliations

Modeling and perception of 'gesture reduction'

R Carré et al. Phonetica. 2000 Apr-Dec.

Abstract

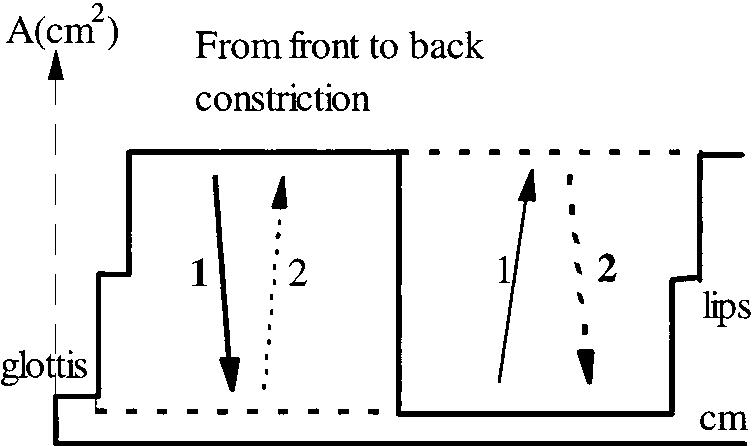
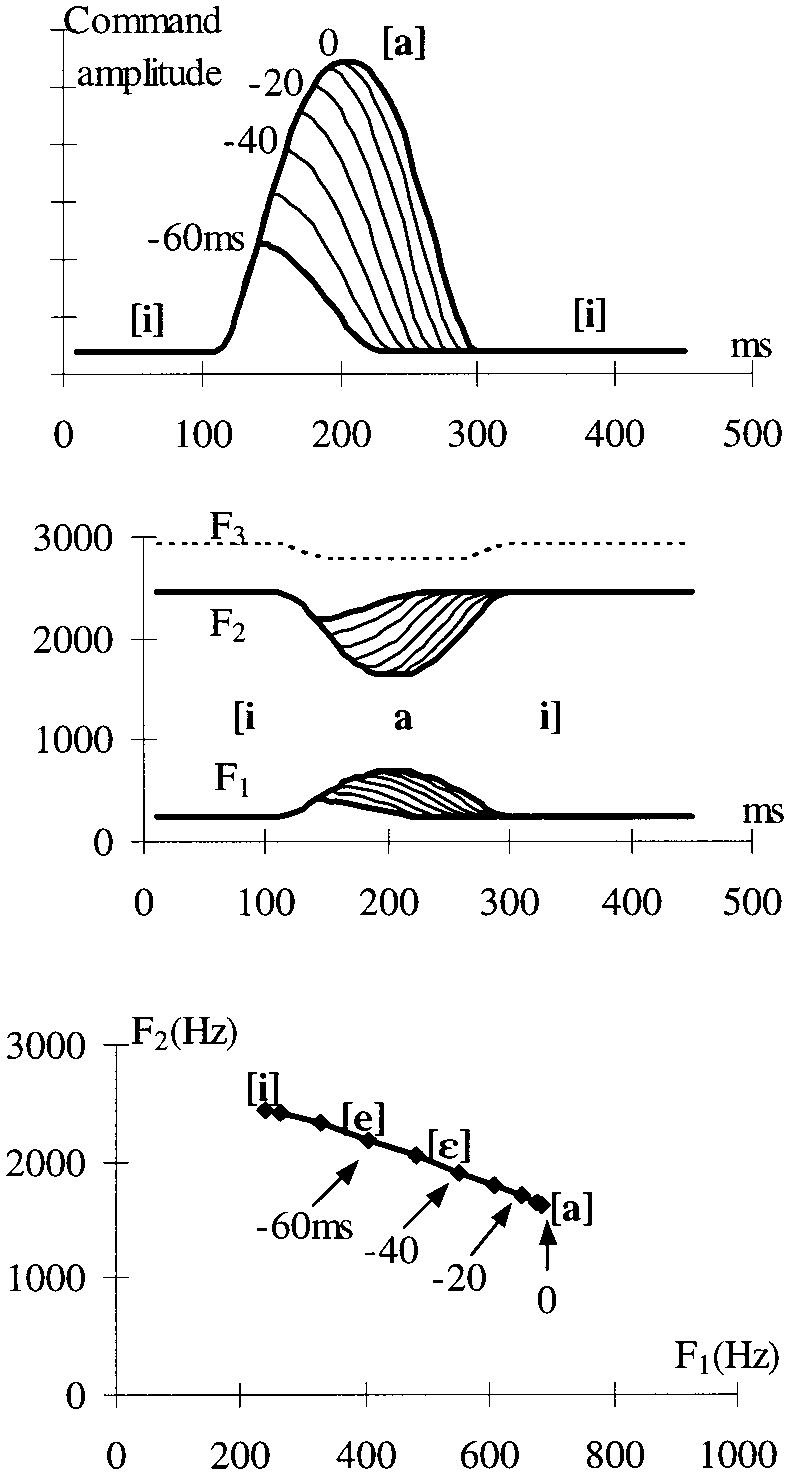
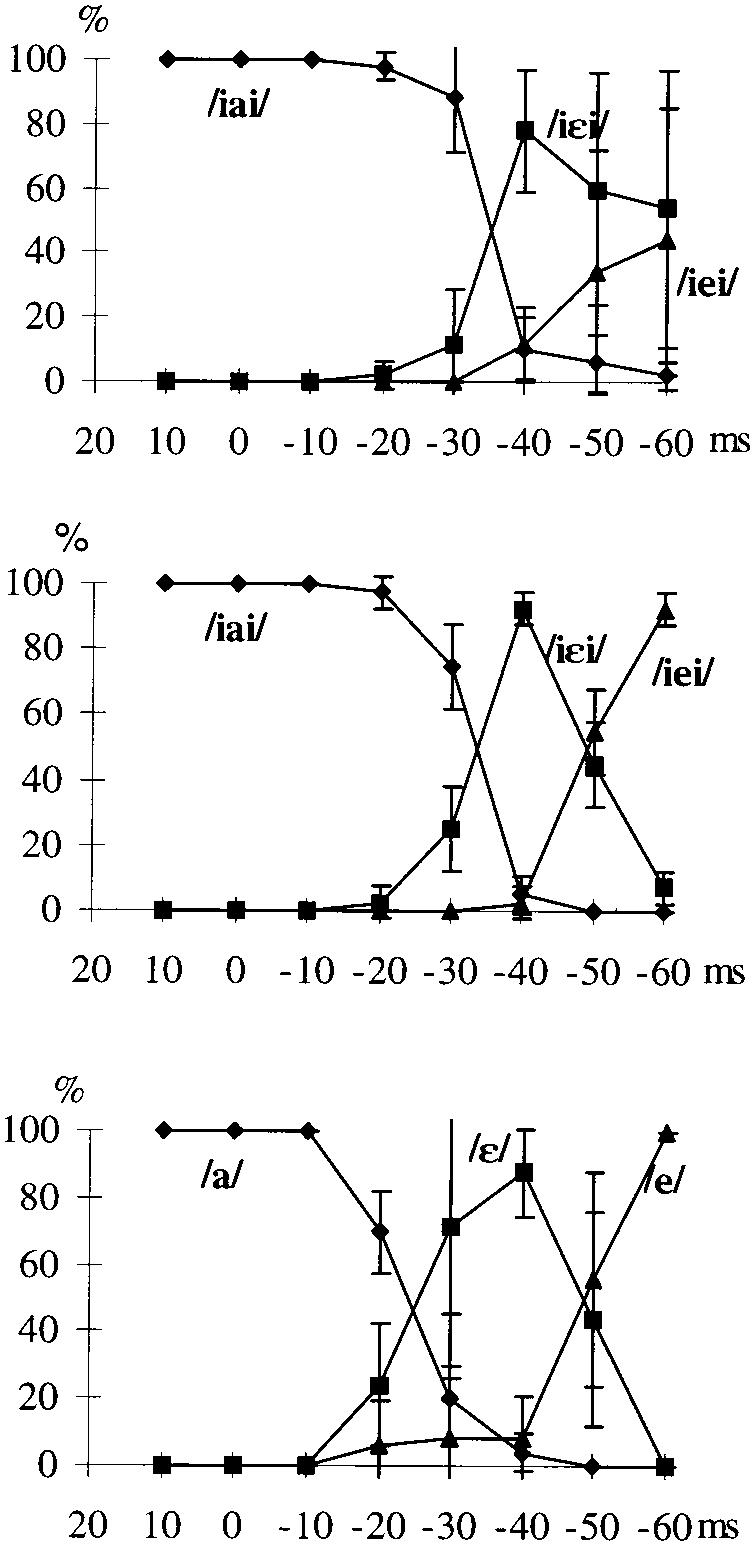
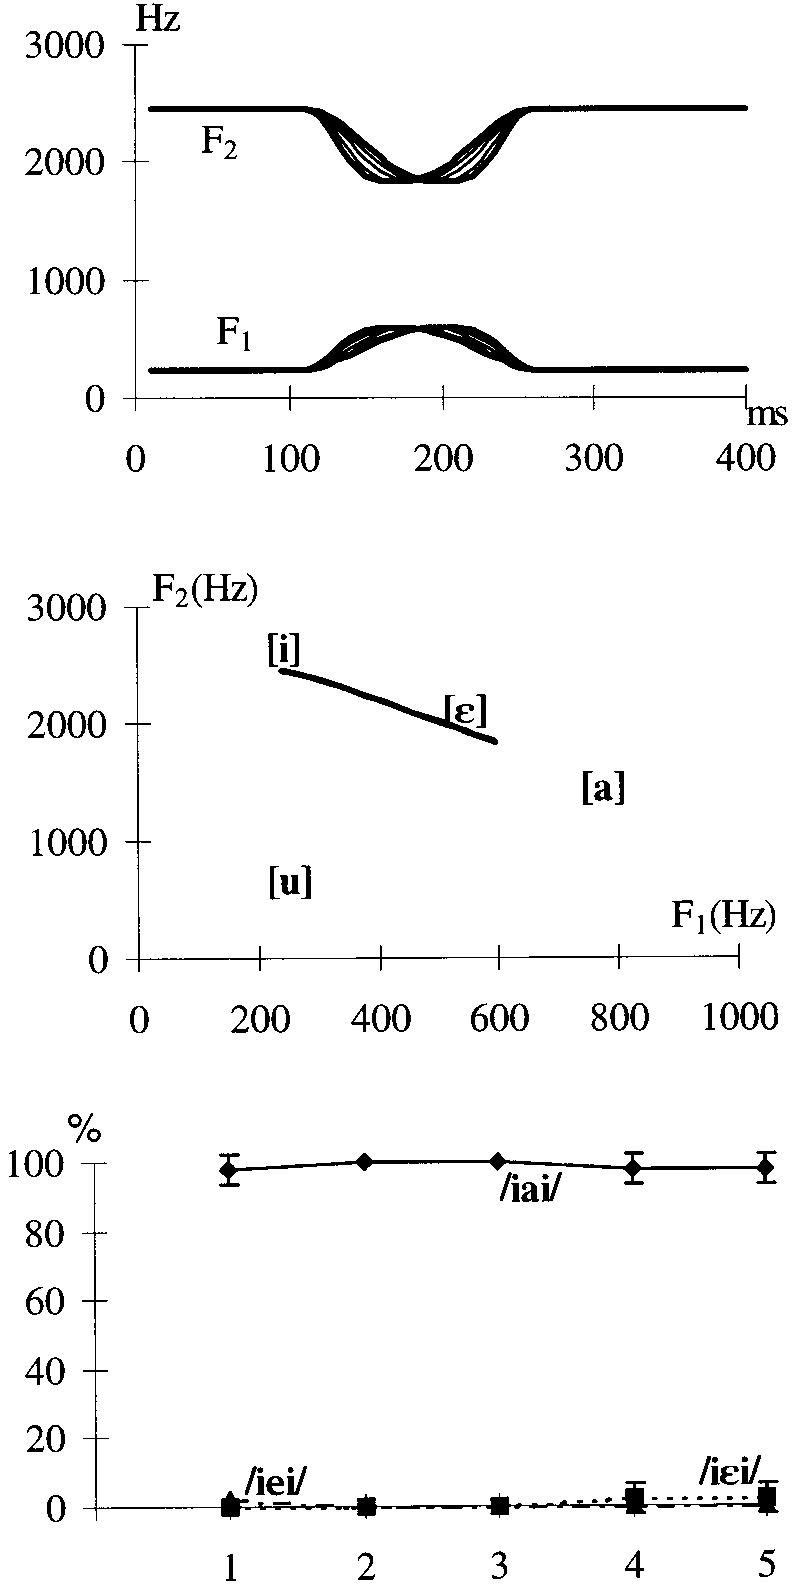
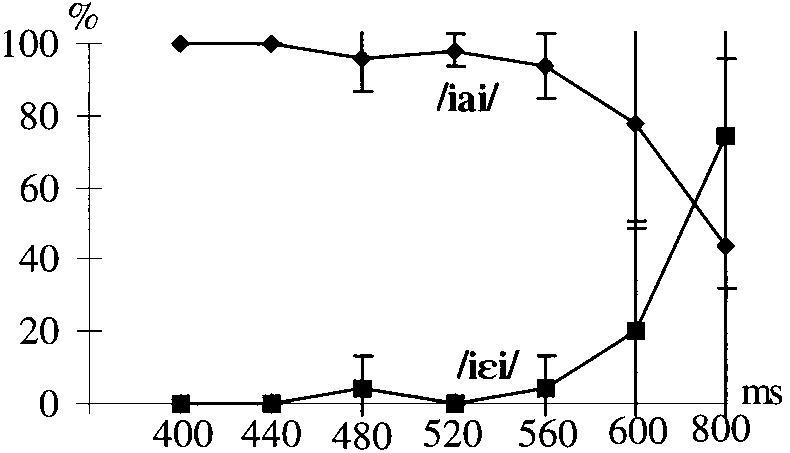
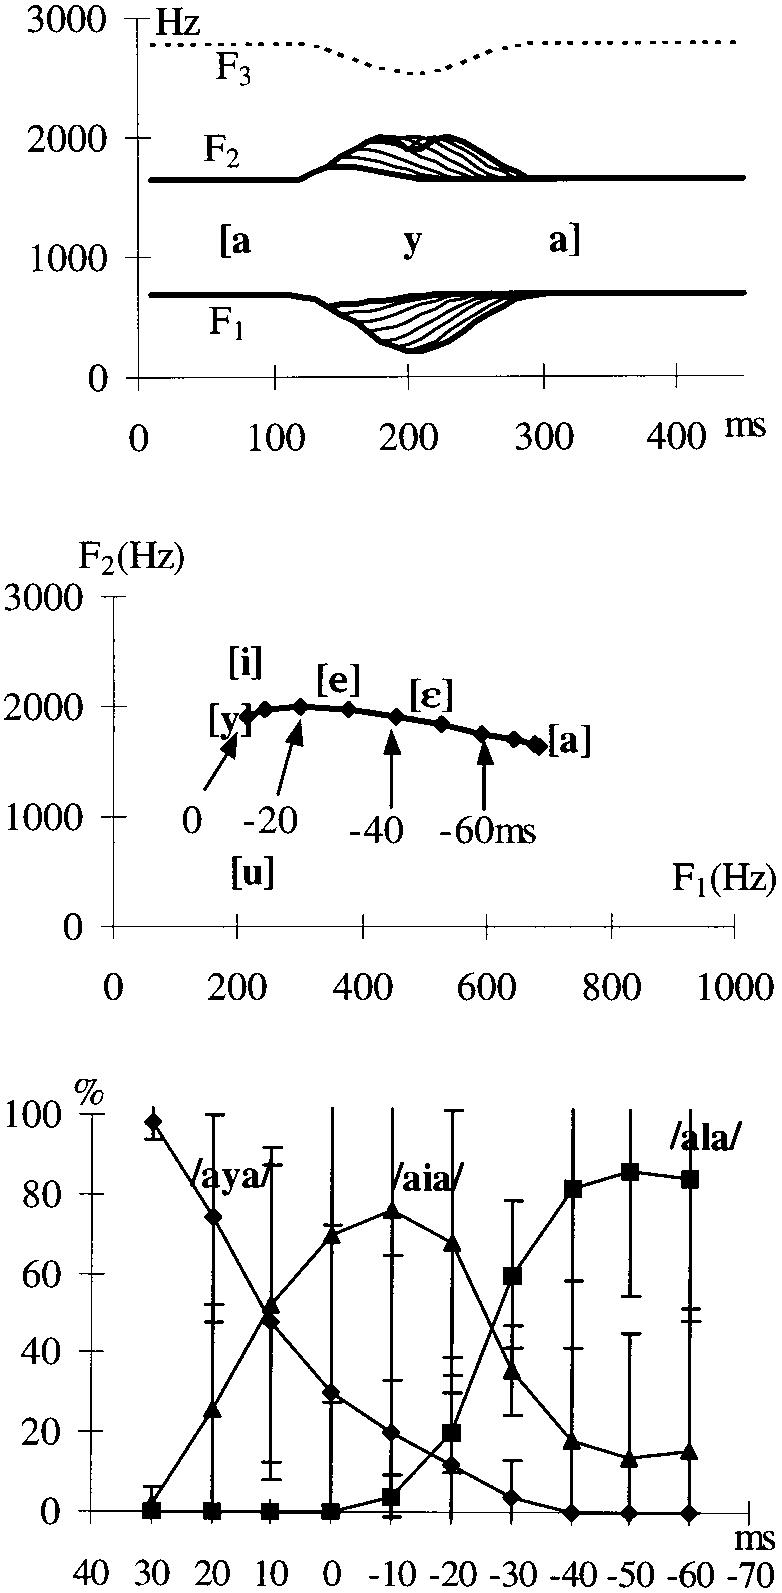
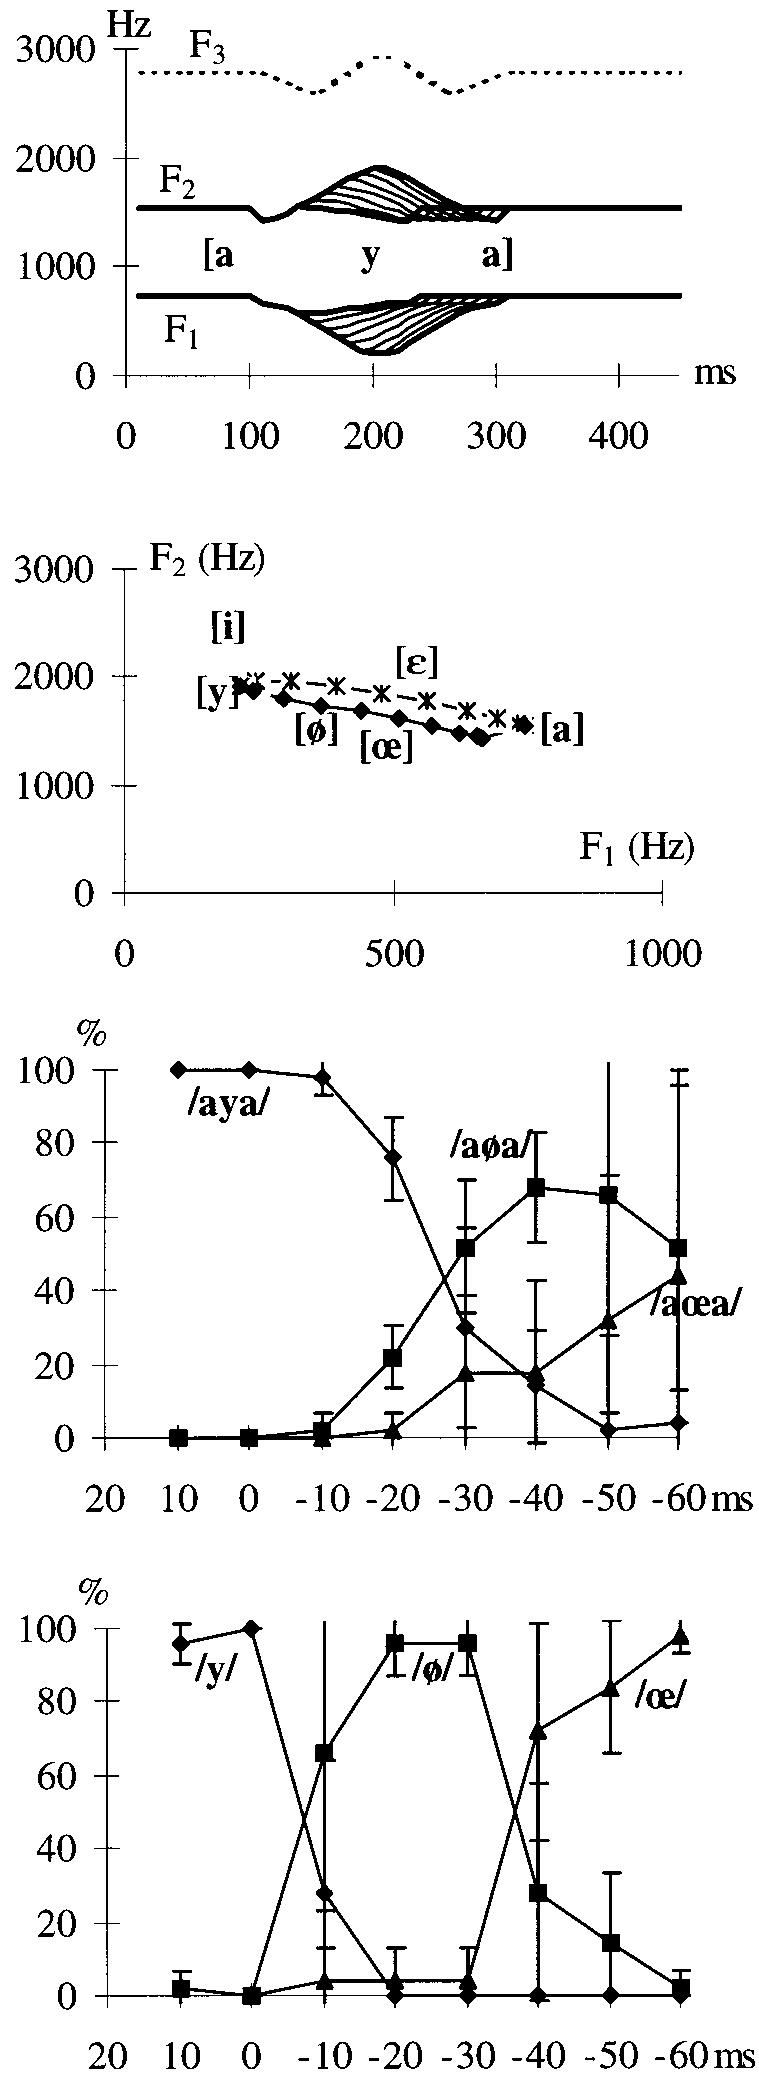
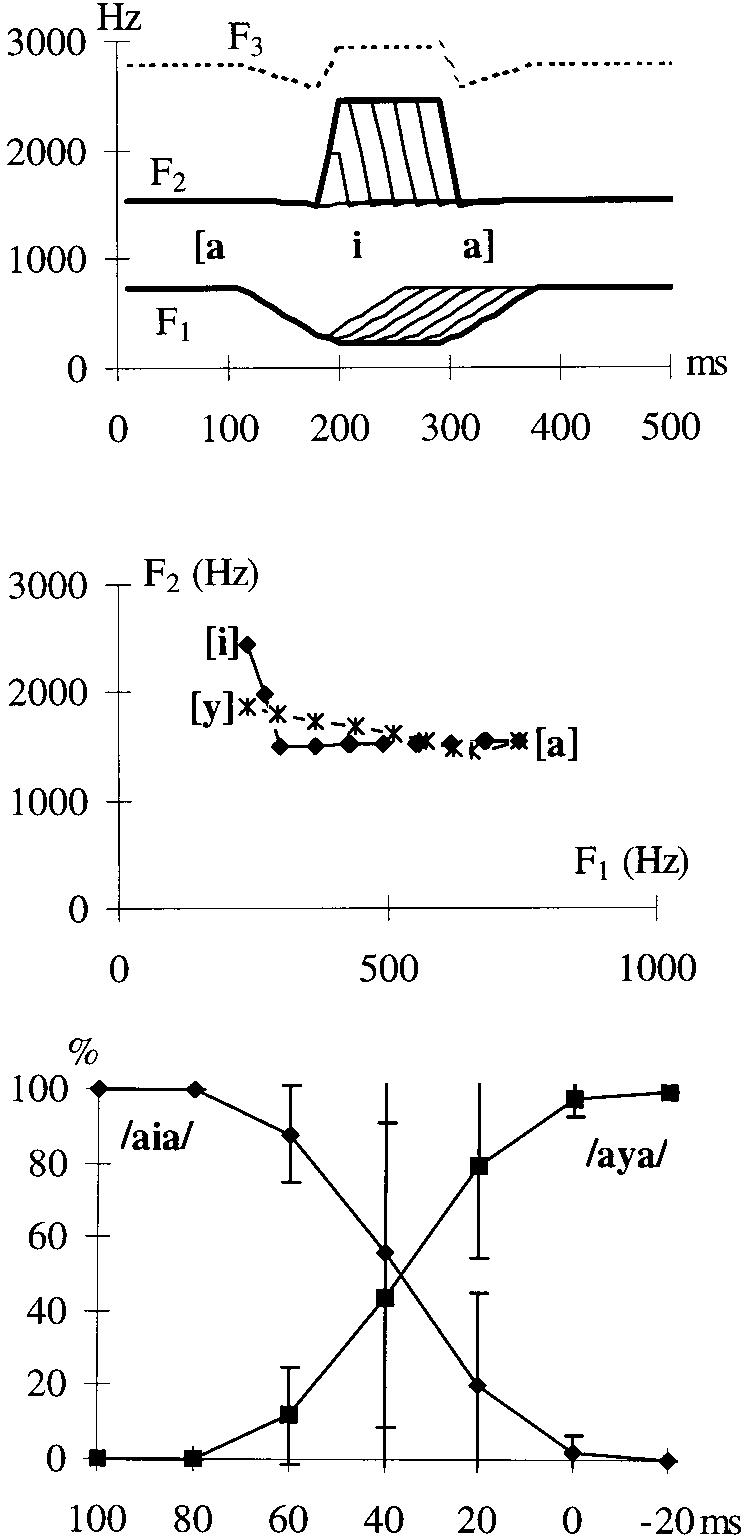
The phenomenon of vowel reduction is investigated by modeling 'gesture reduction' with the use of the Distinctive Region Model (DRM). First, a definition is proposed for the term gesture, i.e. an acoustically efficient command aimed at deforming, in the time domain, the area function of the vocal tract. Second, tests are reported on the perception of vowel-to-vowel transitions obtained with reduced gestures. These tests show that a dual representation of formant transitions is required to explain the reduction phenomenon: the trajectory in the F(1)-F(2) plane and the time course of the formant changes. The results also suggest that time-domain integration of the trajectories constitutes an integral part of the auditory processing of transitions. Perceptual results are also discussed in terms of the acoustic traces of DRM gestures.


Figures

Fig. 1.
Fig. 1.
Schematic diagram of the vocal tract deformation gestures for an [iV2i] sequence. The vocal tract shape of [i] is shown as the solid line, whereas the one for the (arbitrary) V2 is shown as the broken line. The gesture for [iV2] is indicated by the solide arrow (1 and associated 1) and that for the [V2i] by the broken arrow (2 and associated 2).
Fig. 2.
Fig. 2.
Schematic representation of the eight [iV2i] sequences with different degrees of constriction, synthesized to be used as stimuli in experiment 1a. a DRM command amplitude (arbitrary units) as a function of time. b F1 and F2 transitions corresponding to the gesture in a, shown in a spectrogram plot. The temporal representation of F3 is also shown (dotted line) for the case in which the [a] target is reached. c F1-F2 plot of the eight formant trajectories in b. Note that all V2 vowels (shown as points) fall on the [ia] trajectory and can be interpreted as incomplete [iai] transitions, except for the rightmost point. The time labels on some of the points refer to the time of return to the final [i] vowel, before completing the [ia] transition, that is, the time value of vowel reduction.
Fig. 3.
Fig. 3.
Experiments 1a and 1b. a Average labeling results (and standard deviation) of 5 listeners in experiment 1a for V2 in a [iV2i] context. Ordinate: percent responses; V2 = /a/ (filled diamonds), V2 =/ε/ (squares), V2 = /e/ (triangles). Abscissa: point of return of the transition to [i] prior to reaching [a]. b Average labeling results (and standard deviation) of 1 listener in experiment 1a for V2 in a [iV2i] context. c Average labeling results (and standard deviation) of 5 listeners in experiment 1b for a steady-state V2 vowel. Ordinate: percent responses; V2 = /a/ (filled diamonds), V2 = /ε/ (squares), V2 = /e/ (triangles). Abscissa: F1-F2 value of the V2 vowel (fig. 2c) shown as the point of return of the transition to [i] prior to reaching [a], had the vowel been the midpoint of an [iV2i] transition.
Fig. 4.
Fig. 4.
Experiment 1c. a Spectrogram representation of the five different temporal patterns of the formant transitions; note that the transition for all tokens reaches the same V2 and that the total duration of the transition is always constant at 150 ms. b F1-F2 plane representation of the transitions: note that the extreme value, i.e. the V2 vowel corresponds to the formant values of the vowel [ε]. c Average labeling results (and standard deviation) of 5 listeners in experiment 1c for V2 in a [iai] context with changing transition durations. Ordinate: percent responses; V2 = /a/ (filled diamonds), V2 = /ε/ (squares), V2 = /e/ (triangles). Abscissa: Token numbers corresponding to the five different transition slopes (a).
Fig. 5.
Fig. 5.
Average labeling results (and standard deviation) in experiment 1d using a V2 value corresponding to a steady-state [ε]. Ordinate: percent responses; V2 = /a/ (filled diamonds), V2 =/ ε / (squares). Abscissa: total duration of the token.
Fig. 6.
Fig. 6.
Experiment 2a. a Temporal representation of the F1 and F2 transitions of eight of the ten tokens used in the [aV2a] experiment where only two tokens completed the transition to the vowel [y]. The other six had their transitions progressively cut back, i.e. their formant frequencies returned toward those of [a] after reaching various V2 endpoint vowels on the trajectory. The temporal representations of F3 is also shown (dotted line) for the case in which the [y] target is reached. b F1-F2 plane representation of the [aya] transition for the eight tokens shown above. Note that, in contrast to the [iai] trajectory (fig. 2c), the [aya] trajectory is curved. c Results (average and standard deviation) of experiment 2a: Percent /aya/ (filled diamonds), /aia/ (squares), /ala/ (triangles) responses as a function of the duration of [y] or the transition cutback point (i.e. the point of return to [a]) where 0 ms refers to the condition in which the vowel [y] is reached but the transition immediately returns toward [a]. Note that 100% /y/ responses were obtained only for the 30-ms ‘positive cutback’ condition, i.e. for the condition in which there was a 30-ms steady-state [y] before the transition actually took a turn back to [a]. Also, note that the intersubject variability is much larger than the one observed in the subtests of experiment 1.
Fig. 7.
Fig. 7.
Experiments 2b and 2c. a Temporal representation of the F1 and F2 transitions of the eight tokens used in the [aV2a] experiment where only two tokens completed the transition to the vowel [y]. The other six had their transitions progressively cut back,i.e. their formant frequencies returned toward those of [a] after reaching various V2 endpoint vowels on the trajectory. The temporal representation of F3 is also shown (dotted line) for the case in which the [y] target iy reached. b F1-F2 plane representation of the [aya] transition for the eight tokens used in experiment 2b (solid line). Note that, compared with the [aya] trajectory (broken line) shown in figure 6b, the trajectory is symmetrically curved. c Results of experiment 2b: Percent /aya/ (filled diamonds), /aØa/ (squares), /aœa/ (triangles) responses as a function of the duration of [y] or the transition cutback point (i.e. the point of return to [a]) where 0 ms refers to the condition in which the vowel [y] is reached but the transition immediately returns toward [a]. Note that /aya/ responses were obtained for the -20 ms ‘negative cutback’ condition, i.e. for the condition in which there was a 20 ms before reaching the target [y]. Average results of 5 subjects. d Results in experiment 2c: Labeling of steady-state V2 vowels. Ordinate: percent responses V2 = /y/ (filled diamonds), V2 = /Ø/ (squares), V2 = /œ/ (triangles). Abscissa: F1-F2 value of the V2 vowel shown as the point of return of the transition to [a] prior to reaching [y], had the vowel been the midpoint of an [aV2a] transition.
Fig. 8.
Fig. 8.
Experiment 2d. a Temporal representation of the F1 and F2 transitions of the seven tokens used in the [aV2a] experiment where six tokens completed the transition to the vowel [i]. The last one had its transition cut back, i.e. its formant frequencies returned toward those of [a] after reaching V2 endpoint vowel on the trajectory. The temporal representation of F3 is also shown (dotted line) for the case in which the [i] target is reached. b F1-F2 plane representation of the [aia] transition for the seven tokens used in experiment 2d (solid line). Note that, compared with the [aya] trajectory (broken line) shown in figure 7b, the trajectory is also curved but reaches [i]. c Results of experiment 2d: Percent /aia/ (filled diamonds) and /aya/ (squares) responses as a function of the duration of [i] or the transition cutback point (i.e. the point of return to [a]) where 0 ms refers to the condition in which the vowel [y] is reached but the transition immediately returns toward [a].

Similar articles

Cited by

References

    1. d’Alessandro C, Castellengo M. The pitch of short duration vibrato tones. J. acoust. Soc. Am. 1994;95:1617–1630.
    1. Badin P, Fant G.198453–107.Notes on the vocal tract computations. Q. Prog. Status Rep., Speech Transm. Lab., R. Inst. Technol., Stockh., No. 2/3
    1. Beautemps D.1993. Récupération des gestes de la parole ὰ partir de trajectoires formantiques: identification de cibles vocaliques non atteintes et modèles pour les profils sagittaux des consonnes fricatives; thèse Institut National Polytechnique, Grenoble
    1. Browman C, Goldstein L. Ewan, Anderson, Phonol. Yb. Cambridge University Press; Cambridge: 1986. Towards an articulatory phonology; pp. 219–252.
    1. Brownlee SA. The role of sentence stress in vowel reduction and formant undershoot: a study of lab speech and informal spontaneous speech. University of Texas; Austin: 1996. PhD thesis.

Publication types