. 2000 Sep 18;192(6):813-21.
doi: 10.1084/jem.192.6.813.

Intrinsic constraint on plasmablast growth and extrinsic limits of plasma cell survival

Affiliations

Intrinsic constraint on plasmablast growth and extrinsic limits of plasma cell survival

D M Sze et al. J Exp Med. .

Abstract

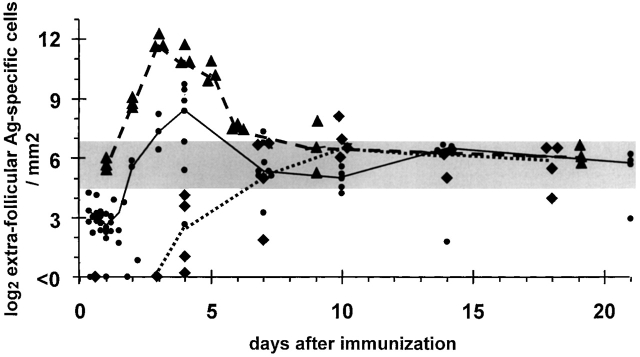
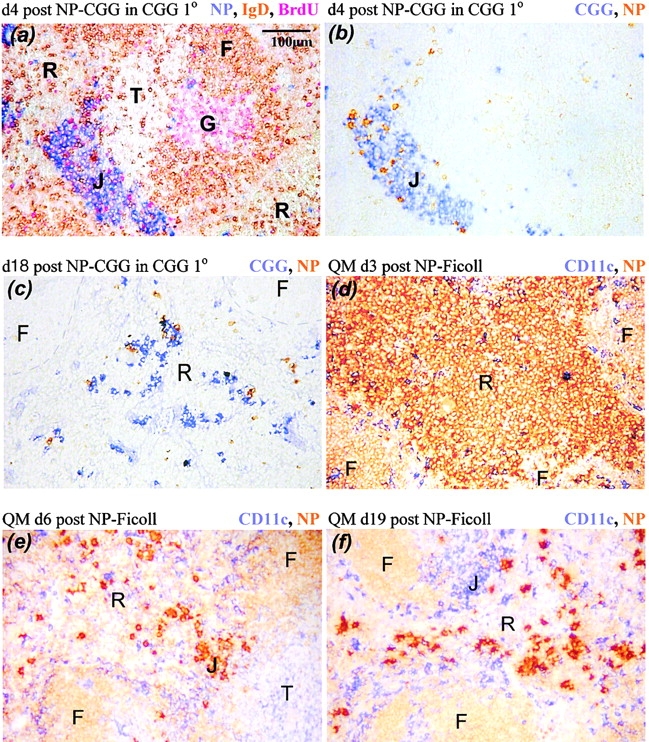
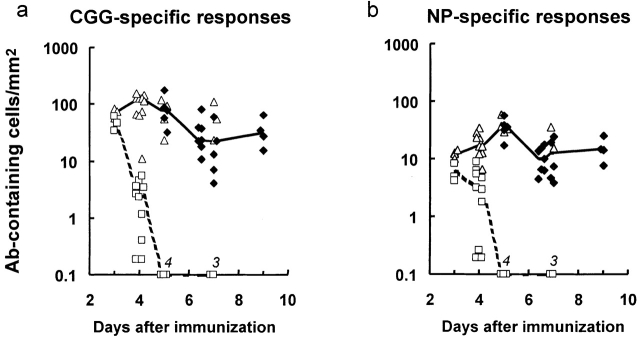
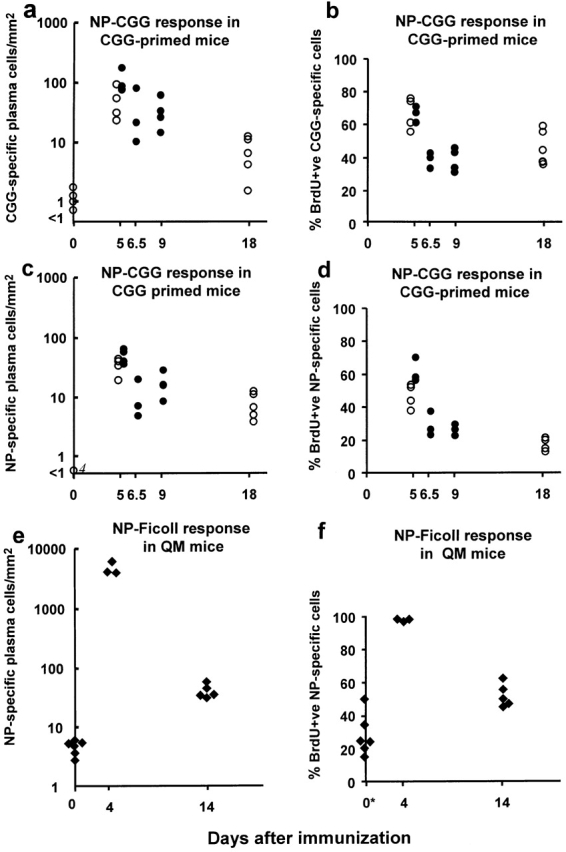
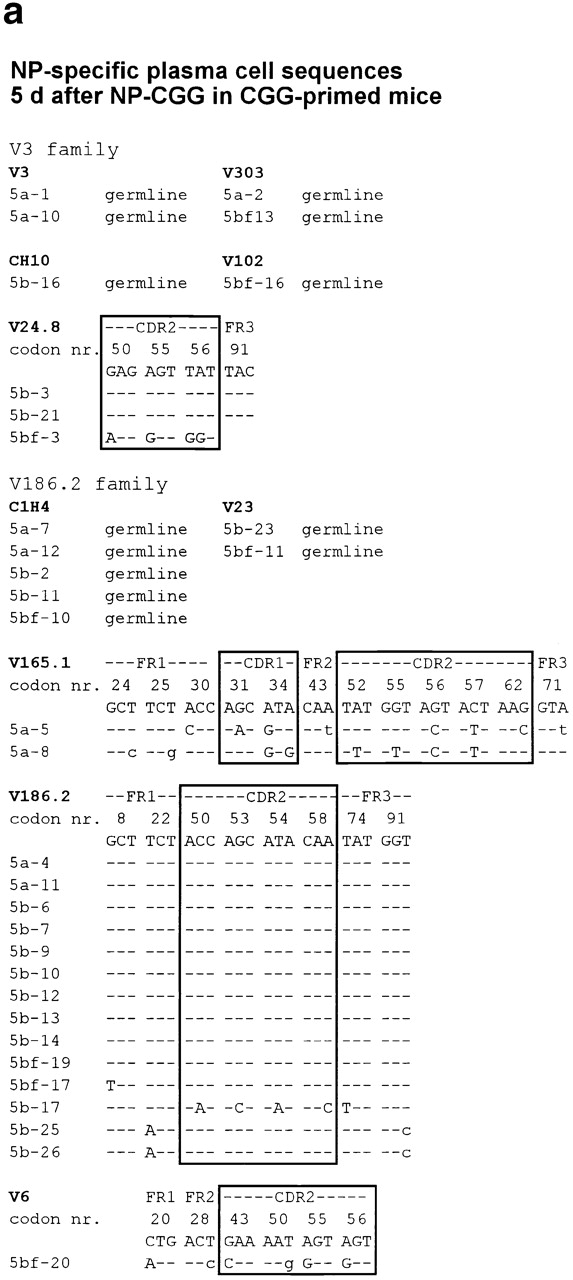
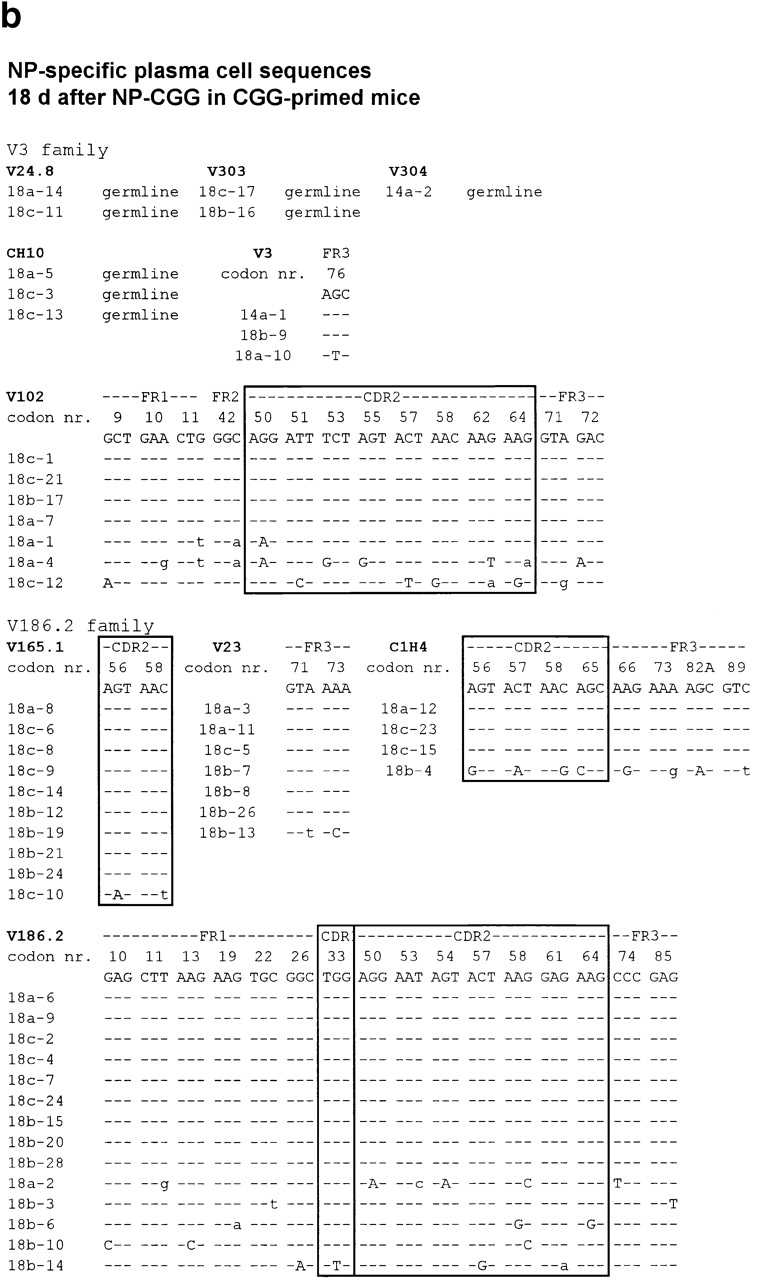
B cells recruited into splenic antibody responses grow exponentially, either in extrafollicular foci as plasmablasts, or in follicles where they form germinal centers. Both responses yield plasma cells. Although many splenic plasma cells survive <3 d, some live much longer. This study shows that early plasma cell death relates to a finite capacity of the spleen to sustain plasma cells rather than a life span endowed by the cell's origin or the quality of antibody it produces. Antibody responses were compared where the peak numbers of plasma cells in spleen sections varied between 100 and 5,000 cells/mm(2). In each response, plasmablast clones divided some five times, with the peak numbers of plasma cells produced relating directly to the number of B cells recruited into the response. The spleen seems to have the capacity to sustain between 20 and 100 plasma cells/mm(2). When this number is exceeded, there is a loss of excess cells. Immunoglobulin variable region gene sequencing, and 5-bromo-2'-deoxyuridine pulse-chase studies indicate that long-lived splenic plasma cells are a mixture of cells derived from the extrafollicular and germinal center responses and cells derived from virgin and memory B cells. Only a proportion has switched immunoglobulin class.


Figures

Figure 1
Figure 1
Evidence that plasma cells go through a fixed number of cell cycles irrespective of the number of B cells recruited into extrafollicular antibody responses, but that the spleen has a finite capacity to sustain plasma cells produced. The horizontal gray bar indicates the range of sustainable plasma cell numbers. Three examples are given of plasmablast growth, differentiation, and survival where the starting number of B cells recruited into the extrafollicular response varies. The number of cells recruited into the response is identified by the number of antigen-specific B cells found in the outer T zone 12–24 h after immunization. These then go into exponential growth for 3 d. Diamonds represent values obtained from individual B10A mice during a primary response to NP-CGG (reference 4); the dotted line is drawn through median values. The delay in the onset of plasmablast growth in this response reflects the time taken for help from primed T cells to become available. Filled circles show values for a response of CGG-primed B10A mice to NP-CGG (reference 4); the solid line is drawn through median values for this response. Triangles represent values for red pulp NP-specific plasma cells obtained during the response of QM mice to NP-Ficoll (reference 5). Some 60% of the B cells these mice have transgenic receptors specific for NP; the dashed line is drawn through median values of this response.
Figure 2
Figure 2
The distribution of plasma cells during the responses to NP-CGG in CGG-primed normal mice (a–c) and to NP-Ficoll in QM mice in which some 60% of the B cells have high affinity receptors for NP (d–f). The color that identifies molecules in each section is shown at the top right of each panel. (a and b) Sections showing extrafollicular foci (J) at the junction of the red pulp (R) and T zone (T) 4 d after NP-CGG challenge. G, germinal center; F, follicular mantle. Most of the plasma cells in the focus are CGG specific (b). (c and f) The typical dispersed pattern of plasma cells in the red pulp late in antibody responses, showing (f) a junction zone with CD11chigh dendritic cells now largely free of NP-specific plasma cells. (d) NP-specific plasmablasts filling the red pulp of QM mice 3 d after immunization with NP-Ficoll. (e) A QM mouse 3 d later in the response when most of the NP-specific antibody-forming cells have died, with a cluster of residual plasma cells in a junction zone (J).
Figure 3
Figure 3
The peak number, proliferation, and decline of red pulp antigen-specific antibody-containing cells in mice primed with CGG and reimmunized with NP-CGG. (a) The total number of CGG-binding plasmablasts and plasma cells/mm2 of red pulp in individual mice (♦ and ▵, respectively); medians are joined by a solid line. The number of CGG-binding cells that had taken up BrdU in the 2 h before the spleen was taken are shown (□); medians are joined by a dashed line (the BrdU labeling data were obtained from the mice whose total CGG-specific antibody-containing cell counts are shown [▵]). (b) Equivalent results for NP-binding plasmablasts and plasma cells in the same mice studied in panel a. Numbers on x-axis in italics indicate observations with values below the scale.
Figure 4
Figure 4
The number of antibody-containing cells and the proportion labeled by a BrdU pulse given from 60 to 96 h (○) or from 72 to 96 h (•) after CGG-primed mice had been immunized with NP-CGG, or for the first 4 d of the response of QM mice to NP-Ficoll (♦). (a) The total number of CGG-binding cells in the red pulp at intervals after immunization. (b) The percentage of the CGG-binding cells that were BrdU labeled. (c and d) The equivalent results obtained in the same mice for NP-binding red pulp cells. (e and f) The results for QM mice immunized with NP-Ficoll. *Unimmunized QM mice were given BrdU 14–10 d before the spleen was taken to assess the equivalent turnover of the significant background number of NP-specific plasma cells in the spleens of these mice. Each point shows data from one mouse. Number of cells is expressed as the number/mm2 of red pulp assessed in tissue sections.
Figure 5
Figure 5
Individual Ig V region DNA sequences obtained from (a) 33 and (b) 53 single NP-binding red pulp plasma cells from sections of spleen taken (a) 5 and (b) 18 d after CGG-primed mice had been reimmunized with NP-CGG. The sequences are assigned to individual V segment families, and any mutations from the germline sequence are indicated; only those codons that differ from the reference sequences are shown. The sequences are set out in two broad Ig V segment families, V3 and V186.2. Lowercase letters indicate silent mutations, uppercase characters replacement mutations; dashes indicate identity with the reference sequence. FR, framework region of the V segment. The sequence data summarized in this figure are available from EMBL/GenBank/DDBJ under accession nos. AJ240347, AJ240348, AJ240349, AJ240350, AJ240351, AJ240352, AJ240353, AJ240354, AJ240355, AJ240356, AJ240357, AJ240358, AJ240359, AJ240360, AJ240361, AJ240362, AJ240363, AJ240364, AJ240365, AJ240366, AJ240367, AJ240368, AJ240369, AJ240370, AJ240371, AJ240372, AJ240373, AJ240374, AJ240375, AJ240376, AJ240377, AJ240378, AJ240379 (a) and AJ240293, AJ240294, AJ240295, AJ240296, AJ240297, AJ240298, AJ240299, AJ240300, AJ240301, AJ240302, AJ240303, AJ240304, AJ240305, AJ240306, AJ240307, AJ240308, AJ240309, AJ240310, AJ240311, AJ240312, AJ240313, AJ240314, AJ240315, AJ240316, AJ240317, AJ240318, AJ240319, AJ240320, AJ240321, AJ240322, AJ240323, AJ240324, AJ240325, AJ240326, AJ240327, AJ240328, AJ240329, AJ240330, AJ240331, AJ240332, AJ240333, AJ240334, AJ240335, AJ240336, AJ240337, AJ240338, AJ240339, AJ240340, AJ240341, AJ240342, AJ240343, AJ240344, AJ240345, AJ240346 (b). Sequences V303 and V304 are likely to be new germline V segment genes, as they have been found after immunization with a TI-2 antigen by others (EMBL/GenBank/DDBJ accession no. AF 045500), and we have found them repeatedly in responses to NP-Ficoll.
Figure 5
Figure 5
Individual Ig V region DNA sequences obtained from (a) 33 and (b) 53 single NP-binding red pulp plasma cells from sections of spleen taken (a) 5 and (b) 18 d after CGG-primed mice had been reimmunized with NP-CGG. The sequences are assigned to individual V segment families, and any mutations from the germline sequence are indicated; only those codons that differ from the reference sequences are shown. The sequences are set out in two broad Ig V segment families, V3 and V186.2. Lowercase letters indicate silent mutations, uppercase characters replacement mutations; dashes indicate identity with the reference sequence. FR, framework region of the V segment. The sequence data summarized in this figure are available from EMBL/GenBank/DDBJ under accession nos. AJ240347, AJ240348, AJ240349, AJ240350, AJ240351, AJ240352, AJ240353, AJ240354, AJ240355, AJ240356, AJ240357, AJ240358, AJ240359, AJ240360, AJ240361, AJ240362, AJ240363, AJ240364, AJ240365, AJ240366, AJ240367, AJ240368, AJ240369, AJ240370, AJ240371, AJ240372, AJ240373, AJ240374, AJ240375, AJ240376, AJ240377, AJ240378, AJ240379 (a) and AJ240293, AJ240294, AJ240295, AJ240296, AJ240297, AJ240298, AJ240299, AJ240300, AJ240301, AJ240302, AJ240303, AJ240304, AJ240305, AJ240306, AJ240307, AJ240308, AJ240309, AJ240310, AJ240311, AJ240312, AJ240313, AJ240314, AJ240315, AJ240316, AJ240317, AJ240318, AJ240319, AJ240320, AJ240321, AJ240322, AJ240323, AJ240324, AJ240325, AJ240326, AJ240327, AJ240328, AJ240329, AJ240330, AJ240331, AJ240332, AJ240333, AJ240334, AJ240335, AJ240336, AJ240337, AJ240338, AJ240339, AJ240340, AJ240341, AJ240342, AJ240343, AJ240344, AJ240345, AJ240346 (b). Sequences V303 and V304 are likely to be new germline V segment genes, as they have been found after immunization with a TI-2 antigen by others (EMBL/GenBank/DDBJ accession no. AF 045500), and we have found them repeatedly in responses to NP-Ficoll.

Similar articles

Cited by

References

    1. Jacob J., Kassir R., Kelsoe G. In situ studies of the primary immune response to (4-hydroxy-3-nitrophenyl) acetyl. I. The architecture and dynamics of responding cell populations. J. Exp. Med. 1991;173:1165–1175. - PMC - PubMed
    1. Liu Y.J., Zhang J., Lane P.J.L., Chan E.Y.-T., MacLennan I.C.M. Sites of specific B cell activation in primary and secondary responses to T cell-dependent and T cell-independent antigens. Eur. J. Immunol. 1991;21:2951–2962. - PubMed
    1. Jacob J., Kelsoe G. In situ studies of the primary immune response to (4-hydroxy-3-nitrophenyl) acetyl. II. A common clonal origin for periarteriolar lymphoid sheath–associated foci and germinal centers. J. Exp. Med. 1992;176:679–688. - PMC - PubMed
    1. Toellner K.-M., Gulbranson-Judge A., Taylor D.R., Sze D.M.-Y., MacLennan I.C.M. Immunoglobulin switch transcript production in vivo related to the site and time of antigen-specific B cell activation. J. Exp. Med. 1996;183:2303–2312. - PMC - PubMed
    1. García de Vinuesa C., Gulbranson-Judge A., Khan M., O'Leary P., Cascalho M., Wabl M., Klaus G.G.B., Owen M.J., MacLennan I.C.M. Dendritic cells associated with plasmablast survival. Eur. J. Immunol. 1999;29:3712–3721. - PubMed

Publication types

MeSH terms