. 2000 Sep 18;150(6):1435-44.
doi: 10.1083/jcb.150.6.1435.

Single channel properties and regulated expression of Ca(2+) release-activated Ca(2+) (CRAC) channels in human T cells

Affiliations

Single channel properties and regulated expression of Ca(2+) release-activated Ca(2+) (CRAC) channels in human T cells

A F Fomina et al. J Cell Biol. .

Abstract

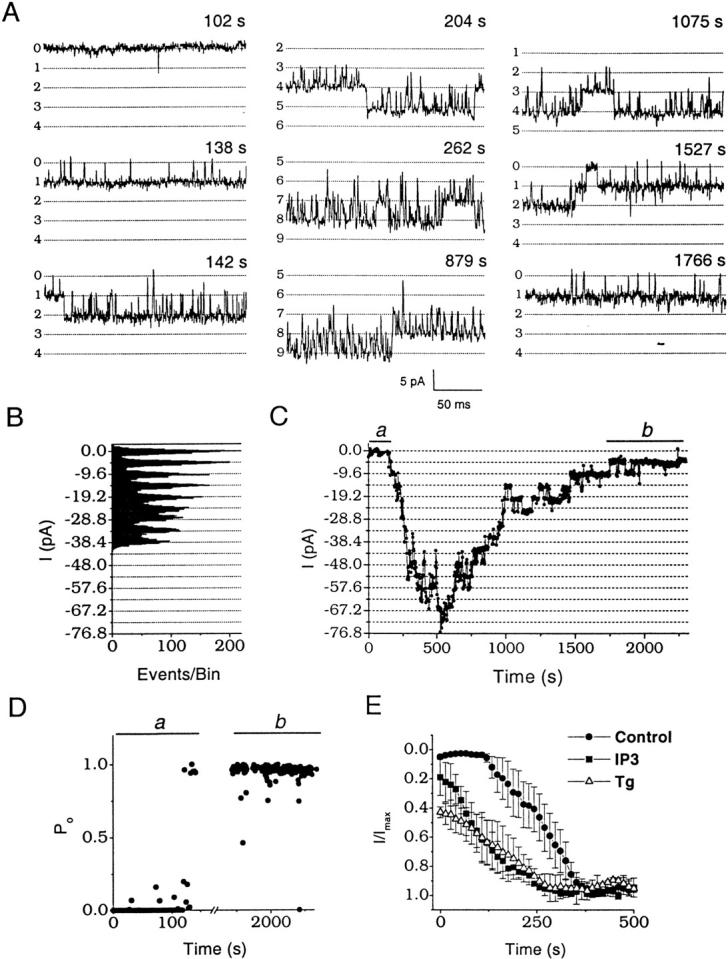
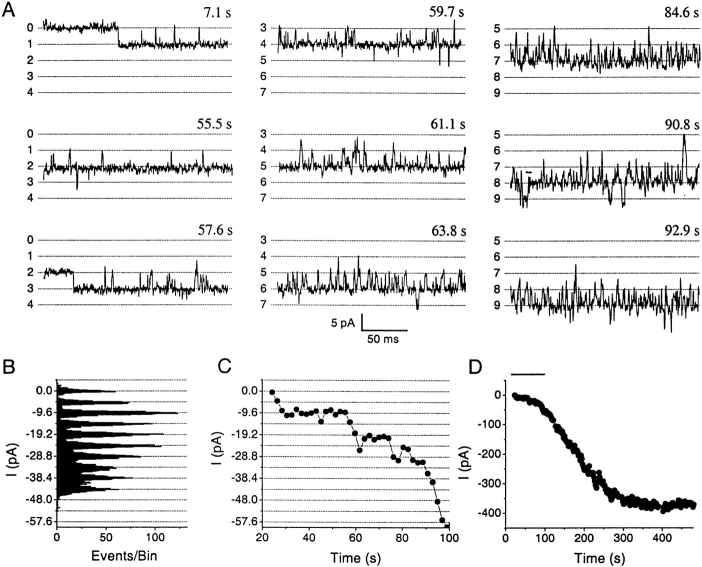
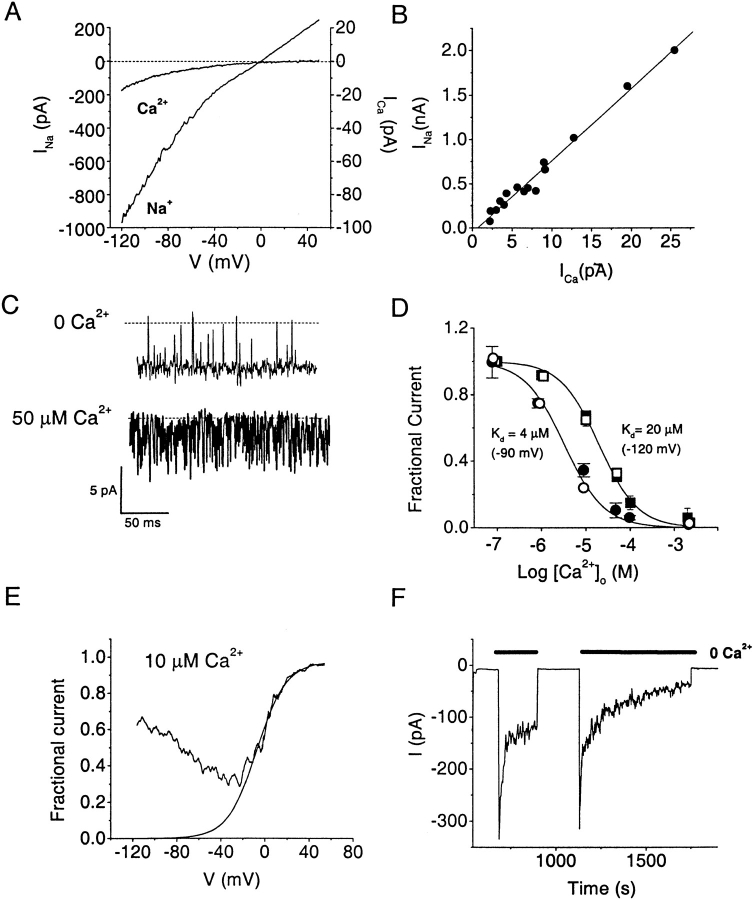
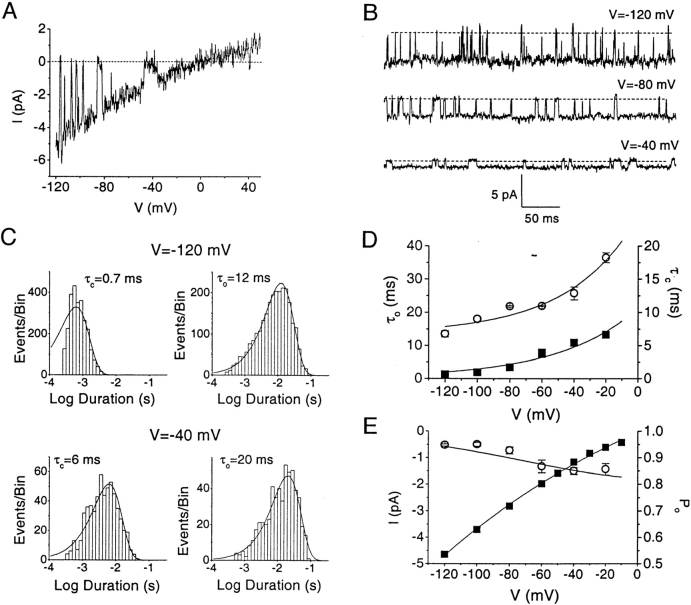
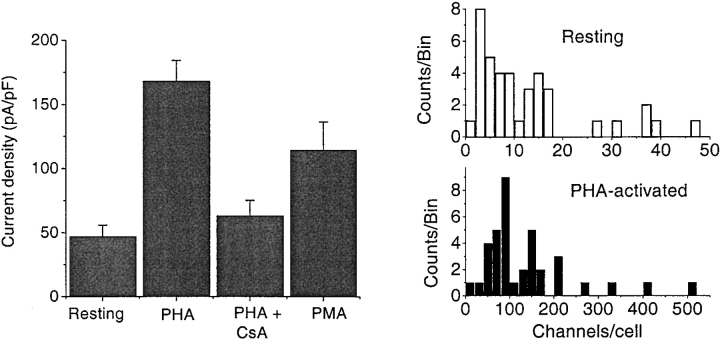
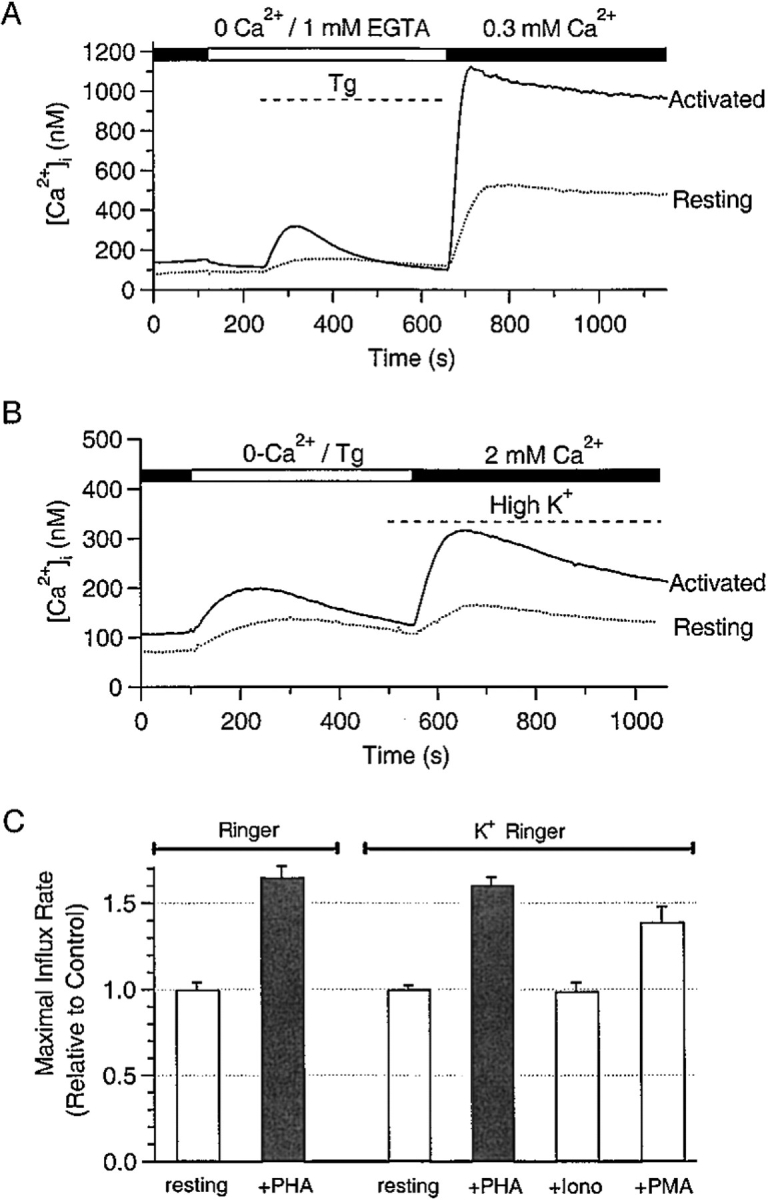
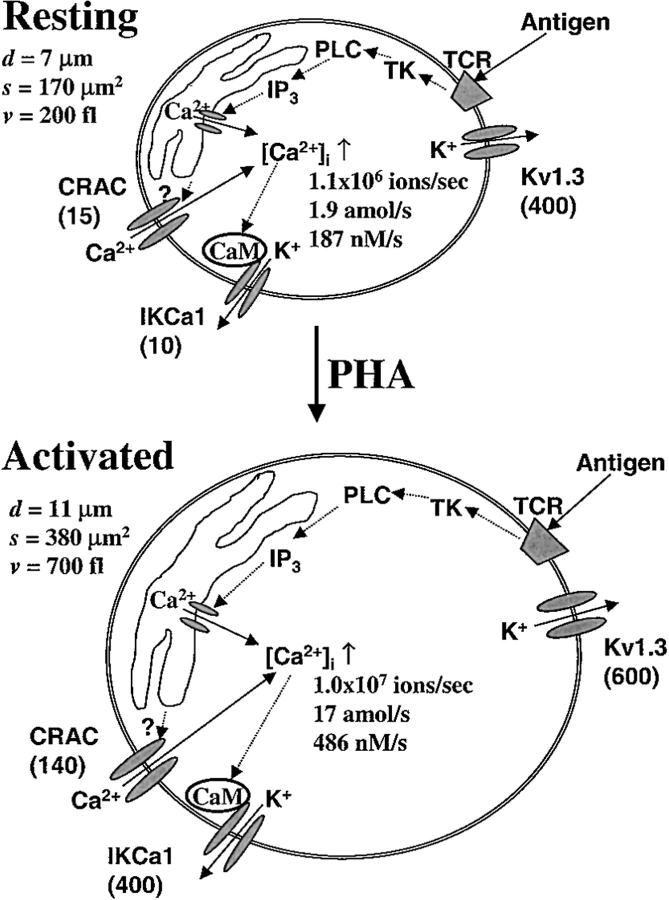
Although the crucial role of Ca(2+) influx in lymphocyte activation has been well documented, little is known about the properties or expression levels of Ca(2+) channels in normal human T lymphocytes. The use of Na(+) as the permeant ion in divalent-free solution permitted Ca(2+) release-activated Ca(2+) (CRAC) channel activation, kinetic properties, and functional expression levels to be investigated with single channel resolution in resting and phytohemagglutinin (PHA)-activated human T cells. Passive Ca(2+) store depletion resulted in the opening of 41-pS CRAC channels characterized by high open probabilities, voltage-dependent block by extracellular Ca(2+) in the micromolar range, selective Ca(2+) permeation in the millimolar range, and inactivation that depended upon intracellular Mg(2+) ions. The number of CRAC channels per cell increased greatly from approximately 15 in resting T cells to approximately 140 in activated T cells. Treatment with the phorbol ester PMA also increased CRAC channel expression to approximately 60 channels per cell, whereas the immunosuppressive drug cyclosporin A (1 microM) suppressed the PHA-induced increase in functional channel expression. Capacitative Ca(2+) influx induced by thapsigargin was also significantly enhanced in activated T cells. We conclude that a surprisingly low number of CRAC channels are sufficient to mediate Ca(2+) influx in human resting T cells, and that the expression of CRAC channels increases approximately 10-fold during activation, resulting in enhanced Ca(2+) signaling.


Figures

Figure 1
Figure 1
Na+ current through CRAC channels in a resting T cell. All currents recorded in divalent-free solution using a Cs+-aspartate pipette solution containing BAPTA with no Mg2+. (A) Sequence of channel activation displaying currents at −120 mV at the indicated times following break in. Horizontal lines are multiples of 4.8 pA, with the number of open channels shown on the left. Please note baseline shifts in channel numbers for the middle and right columns. (B) All-points amplitude histogram (bin size = 0.2 pA) accumulated during nine consecutive current traces recorded at −120 mV, beginning 135 s after break in. Note that the histogram peaks are equally spaced with intervals of 4.8 pA, corresponding to the sequential and sustained opening of eight channels. (C) Time course of whole-cell current recorded from the same resting T cell. The current amplitude at each time point was measured off-line by averaging 5-ms intervals randomly selected within square-pulse traces. (D) Open probability (P o) obtained from current traces with one channel active at the beginning of current activation (a) and after currents ran down to a single remaining active channel (b). a and b correspond to time intervals marked on C. P o values were measured by integrating current traces containing one active channel. Missing points within the horizontal scale break represent skipped traces with more than one channel active. (E) Activation by passive store dialysis, IP3, and Tg. Average time course of CRAC channel currents from representative resting T cells dialyzed with either normal BAPTA-containing pipette solution (Control, •, n = 4), with 30 μM IP3 added to the normal pipette solution (IP3, ▪, n = 3), or after preincubation with 2 μM Tg for 15–45 min (Tg, ▵, n = 3). All current traces were normalized to maximal current amplitude and then averaged.
Figure 2
Figure 2
Na+ currents through CRAC channels in an activated T cell. Same recording conditions as described in the legend to Fig. 1 A. (A) Sequence of channel activation at the indicated times. Horizontal lines are multiples of 4.8 pA, with the number of open channels shown on the left. Again, please note baseline shifts that indicate the number of open channels. (B) Amplitude histogram showing equally spaced peaks corresponding to the first nine channels that opened. (C and D) Time course of CRAC channel activation. C represents the initial time course marked with bar on D on an expanded time scale. Horizontal lines represent equally spaced intervals of 4.8 pA to illustrate the stepwise activation of channels.
Figure 3
Figure 3
Ionic selectivity, rectification, and divalent block of CRAC channels in human T cells. (A) Na+ and Ca2+ currents recorded during a voltage ramp from −120 mV to 50 mV in the absence and presence of 2 mM extracellular Ca2+ in an activated T cell. Note the 10-fold difference in scales for I Na and I Ca. External solutions were changed rapidly between Ca2+-free and Ca2+-containing external solutions. (B) Ratio of Na+ to Ca2+ current. Na+ current amplitudes measured immediately after application of Ca2+ -free solution plotted against Ca2+ current amplitude (2 mM external Ca2+). Each point was obtained from an individual PHA-activated cell (n = 14) from different donors. The straight line is a linear regression fit with a slope factor of 81.4 ± 2.4 and a correlation coefficient of 0.99. (C) Example of single channel currents recorded at −120 mV from a resting T cell. Top trace recorded in Ca2+-free external solution (10 mM HEDTA, no Ca2+ added). Bottom trace recorded after application of 50 μM Ca2+ external solution. (D) External Ca2+ blocks Na+ current through CRAC channels in resting and activated T cells. Currents at different external Ca2+ concentrations were normalized to the current in Ca2+-free external solution. Averaged data from several resting (open symbols) and activated (closed symbols) T cells (n = 4–11 cells), fitted with the equation: Fractional Current = 1 / (1 + [Ca2+]o / K d). Apparent K d values were 4 μM and 20 μM at −90 mV and −120 mV, respectively. (E) Voltage dependence of Ca2+ block. I–V curves recorded in the presence and absence of 10 μM external Ca2+ were divided point by point and fitted with the Boltzmann equation: Fractional Current = 1 / {1 + exp [(V hV) / k]}, with V h = −7.3 mV and k = 13.3 mV. The steepness factor k is equivalent to movement of a single Ca2+ ion 93% of the distance from the outside across the electric field of the membrane to the blocking site within the channel. (F) Ca2+ and Na+ currents recorded at −120 mV from a cell dialyzed with 3.6 mM Mg2+. External solution containing 2 mM Ca2+ was exchanged with Ca2+-free HEDTA-containing solution as indicated. Note the reversible inactivation of Na+ current.
Figure 4
Figure 4
Voltage-dependent properties of single channel currents in resting T cells. (A) Single channel activity during a voltage ramp from −120 to 50 mV. Note the very brief transitions that occur between –120 and –80 mV and longer transitions at more depolarized potentials. (B) Single channel currents recorded at −120, −80, and −40 mV. Again, note that depolarization promotes longer open and closed events. (C) Distributions of open (τo) and closed (τc) times at −120 and −40 mV. For single channel analysis, traces with stable opening of only one channel were selected. The kinetics of transitions between the open and closed levels were idealized by fitting manually controlled cursors to the two levels and setting a discriminator at 50% of the current between levels. Time histograms computed from a minimum of 60 intervals. Histograms of open and closed event durations were fitted by single Gaussian distributions; two or more components did not provide a significantly better fit. Same cell as in B. (D) Voltage dependence of mean open (τo, ○) and mean closed (τc, ▪) times (n = 4). Values of τo and τc for individual cells were calculated by fitting duration histograms with a single Gaussian function, as described in C. Data are fitted with a single exponential function with a steepness factor k = 35 mV for open times and 50 mV for closed times. (E) Single channel current amplitudes (▪) and open probabilities (P o, ○) at varying potentials. Averages from four cells are shown; if not shown, standard error bars are smaller than symbol size. The smooth curve through P o data was obtained from exponential fits of τc and τo (smooth lines on D) according to equation P o = τo/(τo+ τc).
Figure 5
Figure 5
PHA induces functional upregulation of CRAC channels in human T cells. (A) Average CRAC channel Na+ current densities in resting, PHA-activated, PHA + CsA-treated, and PMA-treated T cells. Resting T cells were maintained in culture for 24–72 h (n = 40). Activated T cells were incubated with PHA for 48–96 h (n = 37). Combined data are presented from cells incubated with PHA + CsA for 75 and 96 h (n = 9). PMA-treated cells were incubated with 40 nM PMA for 48–96 h (n = 12). Between 48 and 96 h, there was no statistically significant difference in CRAC channel expression. Average current densities in resting and PHA + CsA-treated cells are significantly different than those in PHA-activated or PMA-treated T cells (Student's t test, P < 0.001). (B) Distributions of the number of CRAC channels per cell in resting (top) and PHA-activated (bottom) cell populations. Note the difference in horizontal scales. Maximal currents were divided by the amplitude of single channel current at −120 mV (4.8 pA).
Figure 6
Figure 6
Enhanced capacitative Ca2+ entry in activated human T cells. (A) Average time course of changes in [Ca2+]i upon removal of external Ca2+, and consequent reintroduction of 300 μM external Ca2+ in resting (n = 56, dashed line) and PHA-activated (72 h in PHA; n = 32, solid line) T cells. Tg (1 μM) was applied in Ca2+-free solution as indicated. Results shown are typical of three to four experiments for each condition with two donors. (B) In this experiment, extracellular solutions were changed to K+-Ringer at the end of the store depletion transient, as indicated. Results shown are from 65 activated and 127 resting cells in a typical experiment. (C) The maximal rate of initial Ca2+ influx was calculated for each cell by finding the maximal slope between each pair of data points. To prevent bias from donor to donor variability, influx rates for activated cells were normalized to the mean influx rate for resting cells from the same donor on the same day. Influx rates in activated cells and in cells stimulated with PMA alone (but not ionomycin alone) are significantly different from those of resting cells (P < 0.01, Mann-Whitney U test). Average maximal influx rates in normal Ringer solution from 320 resting and 163 activated T cells (two donors), and in K+ Ringer solution from 452 resting, 382 activated (five donors), 210 ionomycin-treated (two donors), and 72 PMA-treated T cells (one donor) were compiled for this graph.
Figure 7
Figure 7
Channel expression and calculated Ca2+ influx in resting and activated T lymphocytes. The two cells depicted in cartoon form represent typical resting (top) and activated (bottom) T cells. Diameters (d), surface areas (s), and volumes (v) are representative of cells selected for recording. Within each cell, a signal transduction pathway leads from antigen binding to the TCR, activating tyrosine kinases (TK), phosphorylating phospholipase C (PLC), generating IP3, and releasing Ca2+ from the store. Ca2+ influx through CRAC channels is activated by the depletion of Ca2+ from the IP3-sensitive intracellular Ca2+ store via an unknown mechanism. Functional expression levels are represented by the average number of channels per cell (in parentheses), for three channel types: voltage-gated K+ channels encoded by Kv1.3 (DeCoursey et al. 1984; Deutsch et al. 1986), Ca2+-activated K+ channels encoded by IKCa1 together with preassociated calmodulin (CaM) (Grissmer et al. 1993; Fanger et al. 1999; Ghanshani et al. 2000), and CRAC channels (this paper, Fig. 5 B). The calculated Ca2+ influx (ions/sec and amol/s) is based upon the number of CRAC channels per cell, the measured single CRAC channel conductance for Na+, the measured ratio of I Ca/I Na, and an assumed membrane potential of −60 mV. The maximal rate of [Ca2+]i increase (d[Ca2+]i/dt in nM/s), resulting from the Ca2+ influx with external Ca2+ of 2 mM is based upon the estimated cell volume and the buffer capacity.

References

    1. Byrne J.A., Butler J.L., Cooper M.D. Differential activation requirements for virgin and memory T cells. J. Immunol. 1988;141:3249–3257. - PubMed
    1. Crabtree G.R. Contingent genetic regulatory events in T lymphocyte activation. Science. 1989;243:355–361. - PubMed
    1. Crabtree G.R. Generic signals and specific outcomessignaling through Ca2+, calcineurin, and NF-AT. Cell. 1999;96:611–614. - PubMed
    1. Crabtree G.R., Clipstone N.A. Signal transmission between the plasma membrane and nucleus of T lymphocytes. Ann. Rev. Biochem. 1994;63:1045–1083. - PubMed
    1. DeCoursey T.E., Chandy K.G., Gupta S., Cahalan M.D. Voltage-gated K+ channels in human T lymphocytesa role in mitogenesis? Nature. 1984;307:465–468. - PubMed

Publication types

MeSH terms