. 2000 Sep;106(6):773-81.
doi: 10.1172/JCI9411.

Role of cathepsin B in intracellular trypsinogen activation and the onset of acute pancreatitis

Affiliations

Role of cathepsin B in intracellular trypsinogen activation and the onset of acute pancreatitis

W Halangk et al. J Clin Invest. 2000 Sep.

Abstract

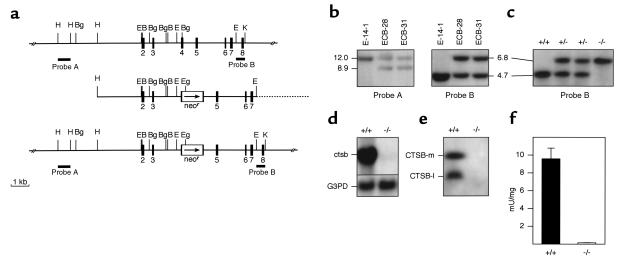
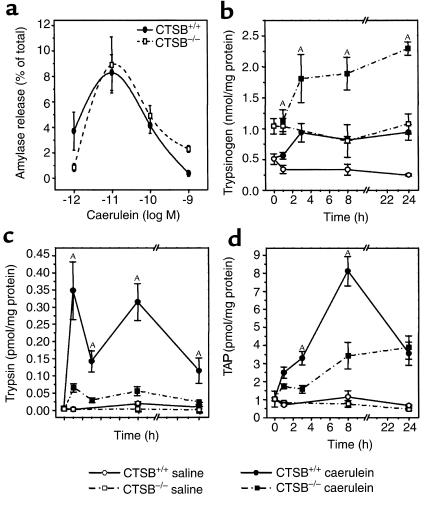
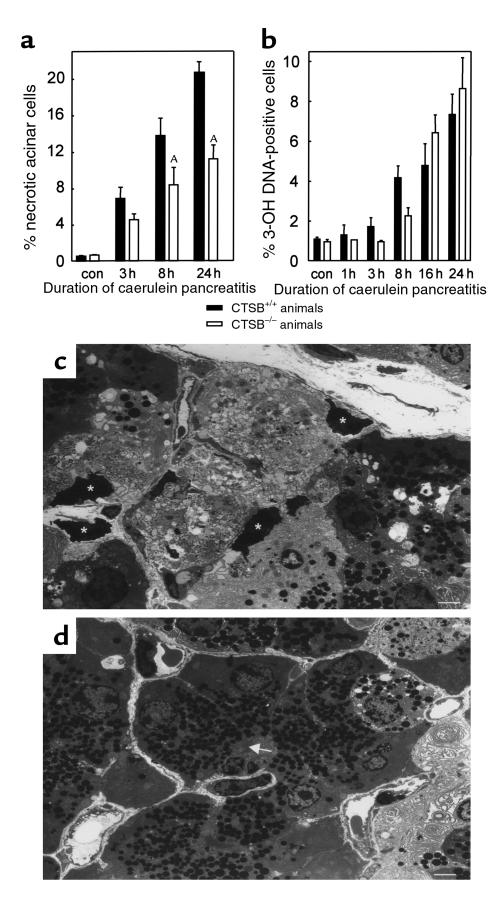
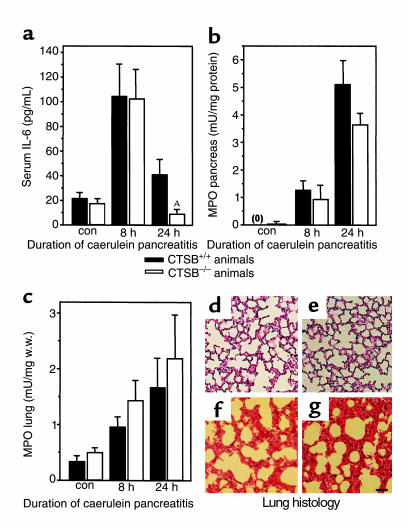
Autodigestion of the pancreas by its own prematurely activated digestive proteases is thought to be an important event in the onset of acute pancreatitis. The mechanism responsible for the intrapancreatic activation of digestive zymogens is unknown, but a recent hypothesis predicts that a redistribution of lysosomal cathepsin B (CTSB) into a zymogen-containing subcellular compartment triggers this event. To test this hypothesis, we used CTSB-deficient mice in which the ctsb gene had been deleted by targeted disruption. After induction of experimental secretagogue-induced pancreatitis, the trypsin activity in the pancreas of ctsb(-/-) animals was more than 80% lower than in ctsb(+/+) animals. Pancreatic damage as indicated by serum activities of amylase and lipase, or by the extent of acinar tissue necrosis, was 50% lower in ctsb(-/-) animals. These experiments provide the first conclusive evidence to our knowledge that cathepsin B plays a role in intrapancreatic trypsinogen activation and the onset of acute pancreatitis.


Figures

Figure 1
Figure 1
Targeted disruption of the ctsb gene. (a) Strategy for inactivation of the ctsb-gene by homologous recombination in embryonic stem cells. (Top) Genomic structure and partial restriction map of the wild-type ctsb-locus (15, 47, 48). Exons are numbered and indicated by black boxes. External probes A and B used for Southern blot analyses are represented by black bars. (Middle) Targeting construct pMCB-11/1neo with 7.7 kb homology to the ctsb gene locus. A neomycin-resistance cassette was inserted into a BglII site in exon 4. The arrow marks the direction of transcription of the neomycin gene. (Bottom) Predicted ctsb-locus after homologous recombination. Broken line: plasmid vector pBluescriptII SK (+). B, BamHI; Bg, BglII; E, EcoRV; Eg, EagI; H, HindIII; K, KpnI. (b) Southern blot analysis of targeted ES cell clones. The 3′-external probe B was hybridized to BglII digested genomic DNA from wild-type E-14-1 ES cells and ES cell clones ECB-28 and ECB-31 with a targeted ctsb allele as indicated by the presence of an additional 6.8-kb DNA fragment. The 5′-external probe A was hybridized to KpnI and EagI digested DNA from the same ES cell clones, confirming homologous recombination in clones ECB-28 and ECB-31. (c) Southern blot analysis of tail DNA from offspring of an intercross of ctsb heterozygotes. Genotypes of progeny are indicated. (d) Northern blot analysis of ctsb mRNA expression. Total RNA was hybridized to a partial ctsb cDNA and a murine glyceraldehyde-3-phosphate dehydrogenase probe (G3PD). (e) Western blot analysis of CTSB protein expression from kidney lysosomal extracts; CTSB-m: mature CTSB (single chain form); CTSB-l: large subunit (two chain form). (f) CTSB enzyme activity in liver lysosomal fractions expressed as mU/mg protein (± SD; n = 3).
Figure 2
Figure 2
Trypsinogen activation during experimental pancreatitis. In the experiment shown in a, dispersed acini were generated from the pancreas of CTSB-deficient and wild-type animals as described in Methods and incubated in different concentrations of caerulein. Amylase secretion over the course of 30 minutes was expressed in percent of total amylase content. In bd, the pancreatitis time course is shown over a 24-hour period for (b) pancreatic trypsinogen content, (c) free trypsin activity in the pancreas, and (d) trypsinogen activation peptide (TAP) in the pancreas. Data points represent the means of four or more pancreatitis animals (n ≥ 3 for controls) at each interval ± SEM. ASignificant differences (P < 0.05) between the CTSB+/+ and the CTSB–/– mice.
Figure 3
Figure 3
Pancreatic damage during experimental pancreatitis. The time course over 24 hours is shown for (a) serum amylase activity, (b) serum lipase activity, and (c) pancreatic edema. Enzyme activities were measured as indicated in Methods, and the increase in pancreatic water content was determined indirectly as increase in pancreatic weight. Data points represent the means of six or more pancreatitis animals (n ≥ 4 for controls) at each interval ± SEM. ASignificant differences (P < 0.05) between the CTSB+/+ and the CTSB–/– mice.
Figure 4
Figure 4
Pancreatic necrosis and apoptosis during experimental pancreatitis. The time course over 24 hours is shown for (a) the percentage of acinar cells that had undergone necrosis and (b) the percentage of cells that had undergone apoptosis after the induction of pancreatitis. The appearance of necrotic acinar cells was quantitated in electron microscopy sections and the number of apoptotic cells was determined using fluorescence labeling of DNA-strand brakes and was expressed as percentage of all DAPI-positive nuclei. Data points represent the means of three or more animals at each interval ± SEM. ASignificant differences (P < 0.05) between the CTSB+/+ and the CTSB–/– mice. In c, a representative micrograph is shown from the pancreas of a wild-type animal after 24 hours of pancreatitis. Note the prominent areas of acinar cell necrosis with resolution of cellular membranes and organelles as well as dark condensed nuclei (asterisks). In d, a corresponding section from a CTSB–/– animal is shown. Here more intact acinar cells with densely packed zymogen granules around the acinar lumen (arrow) are seen, and the area of necrosis is confined to the right-hand margin of the micrograph. Calibration bars = 10 μm.
Figure 5
Figure 5
Extrapancreatic manifestations of experimental pancreatitis. The time course over 24 hours is shown for (a) serum concentrations of IL-6, (b) MPO levels in the pancreas, (c) MPO levels in the lungs, and (dg) morphological changes in the lungs. Data points represent the means of five or more animals at each interval ± SEM. ASignificant differences (P < 0.05) between CTSB+/+ and CTSB–/– animals. (dg) Representative examples for the lung histology of saline-injected control (CTSB+/+, d; CTSB–/–, e) mice, and pancreatitis animals at 24 hours of the disease (CTSB+/+, f; CTSB–/–, g) are shown. Note that the thickening of the interalveolar tissue, its hyperemia, and the infiltration by leukocytes are indistinguishable between the CTSB+/+ and CTSB–/– group of animals. Calibration bar = 100 μm.

References

    1. Chiari H. Über die Selbstverdauung des menschlichen Pankreas. Zeitschrift für Heilkunde. 1896;17:69–96.
    1. Whitcomb DC. Early trypsinogen activation in acute pancreatitis. Gastroenterology. 1999;116:770–772. - PubMed
    1. Lerch MM, et al. Acute necrotising pancreatitis in the opossum: earliest morphologic changes involve acinar cells. Gastroenterology. 1992;103:205–213. - PubMed
    1. Whitcomb DC, et al. Hereditary pancreatitis is caused by a mutation in the cationic trypsinogen gene. Nat Genet. 1996;14:141–145. - PubMed
    1. Gudgeon AM, et al. Trypsinogen activation peptides assay in the early prediction of severity of acute pancreatitis. Lancet. 1990;335:4–8. - PubMed

Publication types

MeSH terms