. 2000 Sep;106(6):793-802.
doi: 10.1172/JCI10052.

Oxidized LDL reduces monocyte CCR2 expression through pathways involving peroxisome proliferator-activated receptor gamma

Affiliations

Oxidized LDL reduces monocyte CCR2 expression through pathways involving peroxisome proliferator-activated receptor gamma

K H Han et al. J Clin Invest. 2000 Sep.

Abstract

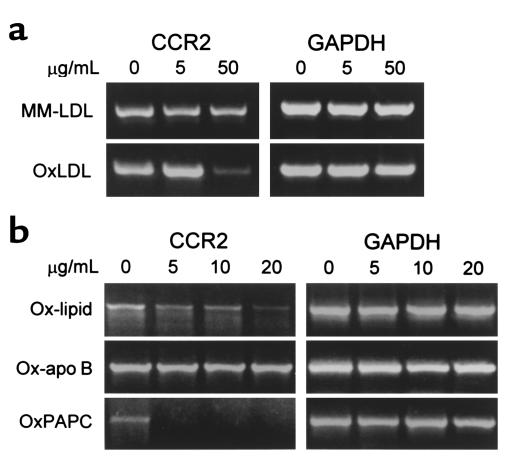
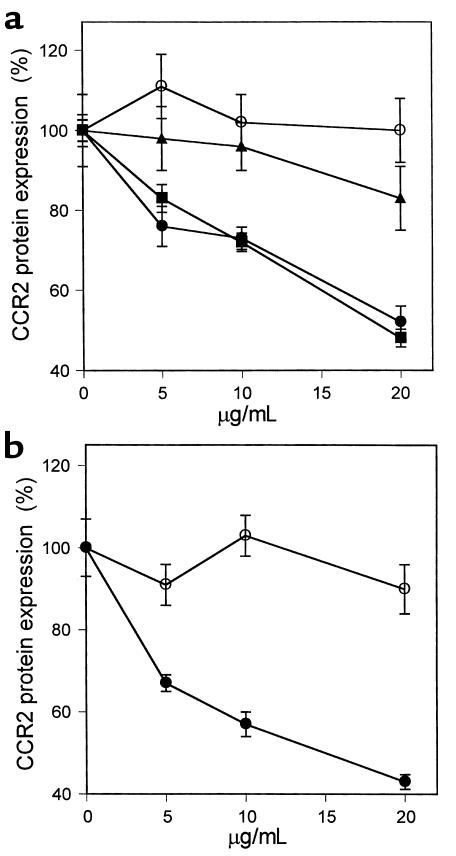
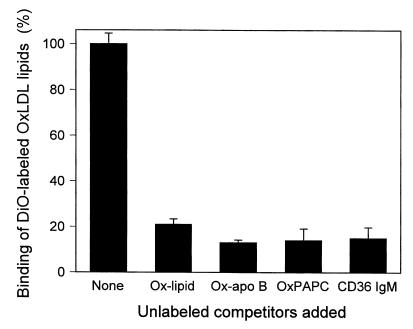
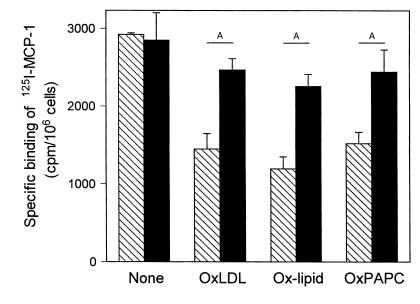
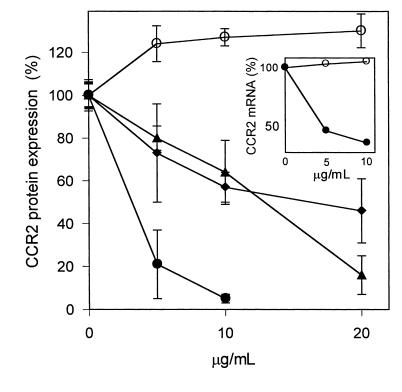
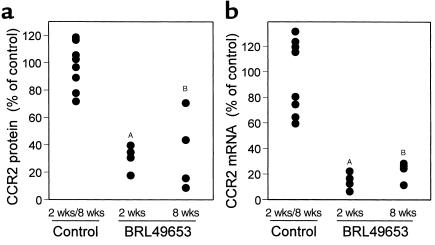
The CCR2-mediated recruitment of monocytes into the vessel wall plays an important role in all stages of atherosclerosis. In recent studies, we have shown that lipoproteins can modulate CCR2 expression and have identified native LDL as a positive regulator. In contrast, oxidized LDL (OxLDL), which is mainly formed in the aortic intima, reduces CCR2 expression, promotes monocyte retention, and may cause pathological accumulation of monocytes in the vessel wall. We now provide evidence that OxLDL reduces monocyte CCR2 expression by activating intracellular signaling pathways that may involve peroxisome proliferator-activated receptor gamma (PPARgamma). Receptor-mediated uptake of the lipoprotein particle was required and allows for delivery of the exogenous ligand to the nuclear receptor. The suppression of CCR2 expression by OxLDL was mediated by lipid components of OxLDL, such as the oxidized linoleic acid metabolites 9-HODE and 13-HODE, known activators of PPARgamma. Modified apoB had no such effect. Consistent with a participation of the PPARgamma signaling pathway, BRL49653 reduced CCR2 expression in freshly isolated human monocytes ex vivo and in circulating mouse monocytes in vivo. These results implicate PPARgamma in the inhibition of CCR2 gene expression by oxidized lipids, which may help retain monocytes at sites of inflammation, such as the atherosclerotic lesion.


Figures

Figure 1
Figure 1
OxLDL lipids, but not apoB, reduce CCR2 transcripts in THP-1 cells. THP-1 cells were treated with modified intact LDL, with microemulsions of lipids from OxLDL, with reconstituted apoB from OxLDL, and with oxidized synthetic PAPC. The effect of the various treatments on CCR2 expression was determined by semiquantitative RT-PCR. GAPDH was analyzed under identical conditions and served as internal standard. (a) THP-1 cells were incubated for 24 hours at 37°C with the indicated concentrations of either minimally modified LDL (MM-LDL) or fully oxidized LDL (OxLDL). The LDL concentrations in the incubation medium are given in micrograms of protein per milliliter. (b) THP-1 cells were incubated with the indicated concentrations of either the isolated lipid (Ox-lipid) or the protein (Ox-apoB) moiety of OxLDL and with oxidized PAPC (OxPAPC). The lipid concentrations are expressed in terms of micrograms of phospholipid per milliliter.
Figure 2
Figure 2
Effect of OxLDL and oxidized phospholipids on expression of CCR2 protein. THP-1 cells were treated with OxLDL and the various protein and lipid fractions prepared from it as described in Figure 1. CCR2 protein was estimated by flow cytometry using a phycoerythrin-labeled mouse anti-human CCR2 Ab. Nonspecific fluorescence was obtained by labeling the cells with phycoerythrin-conjugated mouse isotype IgG. The median CCR2-specific fluorescence is shown as percentage of protein expression relative to that of untreated THP-1 control cells (100%). The concentrations of the lipoproteins are given in micrograms of protein per milliliter and concentrations of the lipids in micrograms of phospholipids per milliliter. (a) THP-1 cells incubated with the indicated concentrations of MM-LDL (filled triangles), OxLDL (filled squares), microemulsion of lipids from OxLDL (filled circles), and reconstituted apoB from OxLDL (open circles). (b) THP-1 cells treated with oxidized (filled circles) and native (open circles) PAPC. The data represent the means ± SD of three independent experiments.
Figure 3
Figure 3
Inhibition of THP-1–cell binding of DiO-labeled OxLDL lipids by various competitors. THP-1 cells were incubated for 1 hour at 4°C with microemulsions of DiO-lipids from OxLDL (0.5 μg of phospholipids per milliliter) in the absence (None) or presence of unlabeled lipids from OxLDL (Ox-lipid) at 20 μg phospholipids/mL, apoB from OxLDL (Ox-apoB) at 20 μg/mL, oxidized synthetic PAPC (OxPAPC) at 20 μg/mL phospholipids, and 10 μg/mL neutralizing mouse anti-human CD36 IgM, OKM5. The effect of the various competitors on the binding of DiO-OxLDL lipids was assessed by flow cytometry. All data are expressed as percentage of binding relative to that seen in the absence of competitor (100%) and represent the means ± SD of three independent experiments. The reductions in binding by the various competitors are statistically significant (P < 0.001, unpaired Student’s t test).
Figure 4
Figure 4
Neutralizing anti-human CD36 IgM, OKM5, blocks the negative regulatory effects of OxLDL and oxidized lipids on CCR2 expression. THP-1 cells were incubated for 24 hours with 10 μg/mL of OxLDL (OxLDL), microemulsions of lipids from OxLDL (Ox-lipid), and microemulsions of oxidized PAPC (OxPAPC) at concentrations of 10 μg phospholipid/ mL in the absence (hatched bars) or presence (solid bars) of neutralizing anti-human CD36 IgM at 10 μg/mL. After 24 hours, the cells were harvested by centrifugation and CCR2 expression was estimated by 125I-MCP-1–binding analysis. Binding of 125I-MCP-1 to untreated control cells was, on average, 3.8 fmol/106 cells, which was not affected by the Ab. All data represent the mean ± SD of three independent experiments. AP < 0.01 (unpaired Student’s t test).
Figure 5
Figure 5
Reduction of CCR2 expression by oxidized linoleic acid. THP-1 cells were incubated for 24 hours with the indicated concentrations of native linoleic acid (open circles), oxidized linoleic acid (filled circles), 9-HODE (filled triangles), and 13-HODE (filled diamonds). Due to cytotoxic effects observed at high concentrations, the final concentration of oxidized linoleic acid was limited to 10 μg/mL. CCR2 protein was estimated by flow cytometry using phycoerythrin-conjugated anti–CCR2 IgG. Nonspecific fluorescence, obtained by labeling of the cells with phycoerythrin-conjugated human isotype IgG, was subtracted, and the median CCR2-specific fluorescence is shown as percentage of protein expression. The values represent the means ± SD of three independent experiments. Inset: The cells were incubated for 24 hours with the indicated concentrations of native (open circles) or oxidized (filled circles) linoleic acid. CCR2 mRNA was estimated by semiquantitative RT-PCR and normalized to GAPDH mRNA estimated under identical conditions.
Figure 6
Figure 6
Activation of PPARγ reduced the expression of functional CCR2. THP-1 cells were incubated for the indicated time periods with 1 μM BRL49653, and the effect of the synthetic PPARγ ligand on CCR2 expression was estimated using 125I-MCP-1–binding assays. Cells that were kept for 72 hours without any additions were used as control. Data are expressed as percentage of specific binding relative to that of control cells (100%), which bound 2.4 ± 0.4 fmol 125I-MCP-1 per 106 cells. As a positive control, cells were treated for 24 hours with 10 ng/mL TNF-α (TNF, 24), which is known to decrease CCR2 expression (42). All data represent the mean ± SD of three independent experiments. AP < 0.05; BP < 0.001 (Mann Whitney U test).
Figure 7
Figure 7
PPARγ-mediated reduction of CCR2 mRNA. THP-1 cells (106) were incubated for 72 hours in the absence (0 hours) or presence (72 hours) of 1 μM BRL49653, as described in Figure 6, and CCR2 transcripts were estimated using competitive RT-PCR. The competitor was added at final dilutions indicated in the graphs. At a dilution of 10–8, 2,000 molecules of competitor were present. The point at which both curves intersect indicates equal concentration of CCR2 and competitor templates. GAPDH was analyzed by semiquantitative RT-PCR to ensure that equal amounts of RNA were used.
Figure 8
Figure 8
Effect of BRL49653 on CCR2 expression in freshly isolated human monocytes. Freshly isolated human monocytes were cultured in the absence or presence of 1 μM BRL49653 for the indicated time periods. Total RNA was isolated from 106 cells, and 0.5 μg was used for analysis of CCR2 transcripts. (a) The time course of the BRL49653-induced reduction of CCR2 mRNA was analyzed by semiquantitative RT-PCR. As an internal standard, GAPDH was analyzed under identical conditions. (b) CCR2 transcripts of cells cultured for 72 hours in the absence (0 hours) or presence (72 hours) of 1 μM BRL49653 were further analyzed using competitive RT-PCR as described in Figure 7. A dilution factor of 10–8 represents 2,000 molecules of competitor templates in the reaction mix. The point at which both curves intersect indicates that both CCR2 and competitor templates were present at equal concentrations.
Figure 9
Figure 9
Reduction of CCR2 expression in circulating monocytes by BRL49653 in vivo. LDL receptor–deficient mice were placed for 2 and 8 weeks on BRL49653 (20 mg/kg body weight), and the effect on CCR2 expression in circulating monocytes was determined. (a) Analysis of CCR2 protein by flow cytometry. Mononuclear leukocytes were isolated from untreated control (n = 8) and BRL49653-treated (n = 4) animals. The monocyte population was identified with anti-CD80 Ab, stained with phycoerythrin-conjugated anti-CCR2 IgG, and analyzed by flow cytometry. In preliminary experiments it was established that the anti-human CCR2 IgG crossreacted with mouse CCR2. Phycoerythrin-labeled non-specific IgG was used to estimate background fluorescence. (b) Analysis of CCR2 transcripts. The monocytes were purified from mononuclear leukocytes by plating. The levels of CCR2 mRNA in circulating monocytes from control and treated animals were estimated by semiquantitative RT-PCR using 0.5 μg of total RNA. All values shown are normalized to GAPDH. P values were estimated using the unpaired Student’s t test. AP < 0.01; BP < 0.05.

References

    1. Gerrity RG. The role of the monocyte in atherogenesis. I. Transition of blood-borne monocytes into foam cells in fatty lesions. Am J Pathol. 1981;103:181–190. - PMC - PubMed
    1. Valente AJ, Rozek MM, Sprague EA, Schwartz CJ. Mechanisms in intimal monocyte-macrophage recruitment. A special role for monocyte chemotactic protein-1. Circulation. 1992;86:III20–III25. - PubMed
    1. Rollins BJ, Yoshimura T, Leonard EJ, Pober JS. Cytokine-activated human endothelial cells synthesize and secrete a monocyte chemoattractant, MCP-1/JE. Am J Pathol. 1990;136:1229–1233. - PMC - PubMed
    1. Shyy YJ, et al. Human monocyte colony-stimulating factor stimulates the gene expression of monocyte chemotactic protein-1 and increases the adhesion of monocytes to endothelial monolayers. J Clin Invest. 1993;92:1745–1751. - PMC - PubMed
    1. Brown Z, et al. Chemokine gene expression and secretion by cytokine-activated human microvascular endothelial cells: differential regulation of monocyte chemoattractant protein-1 and interleukin-8 in response to interferon-gamma. Am J Pathol. 1994;145:913–921. - PMC - PubMed

Publication types

MeSH terms