. 2000 Sep 15;20(18):6920-6.
doi: 10.1523/JNEUROSCI.20-18-06920.2000.

Homocysteine elicits a DNA damage response in neurons that promotes apoptosis and hypersensitivity to excitotoxicity

Affiliations

Homocysteine elicits a DNA damage response in neurons that promotes apoptosis and hypersensitivity to excitotoxicity

I I Kruman et al. J Neurosci. .

Abstract

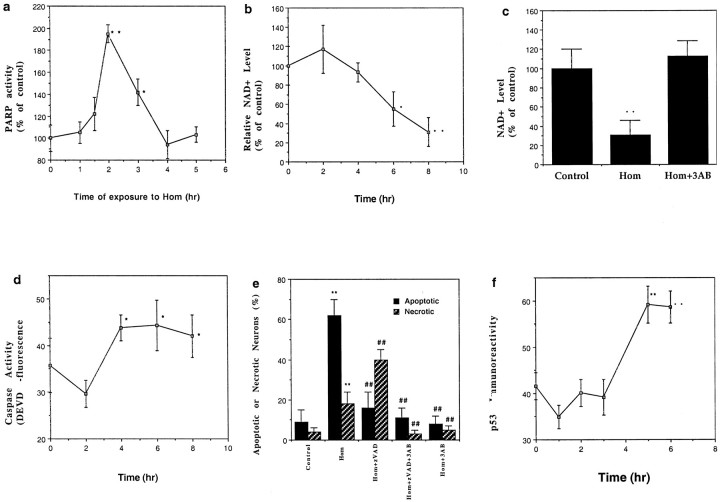
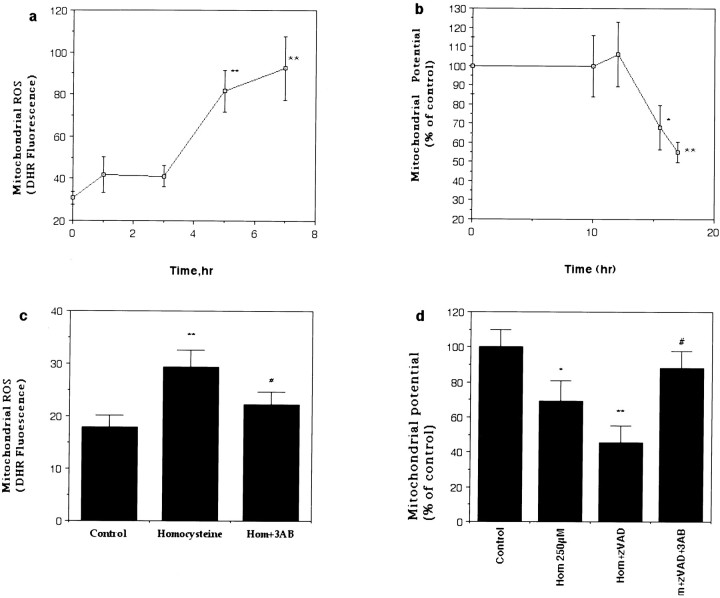
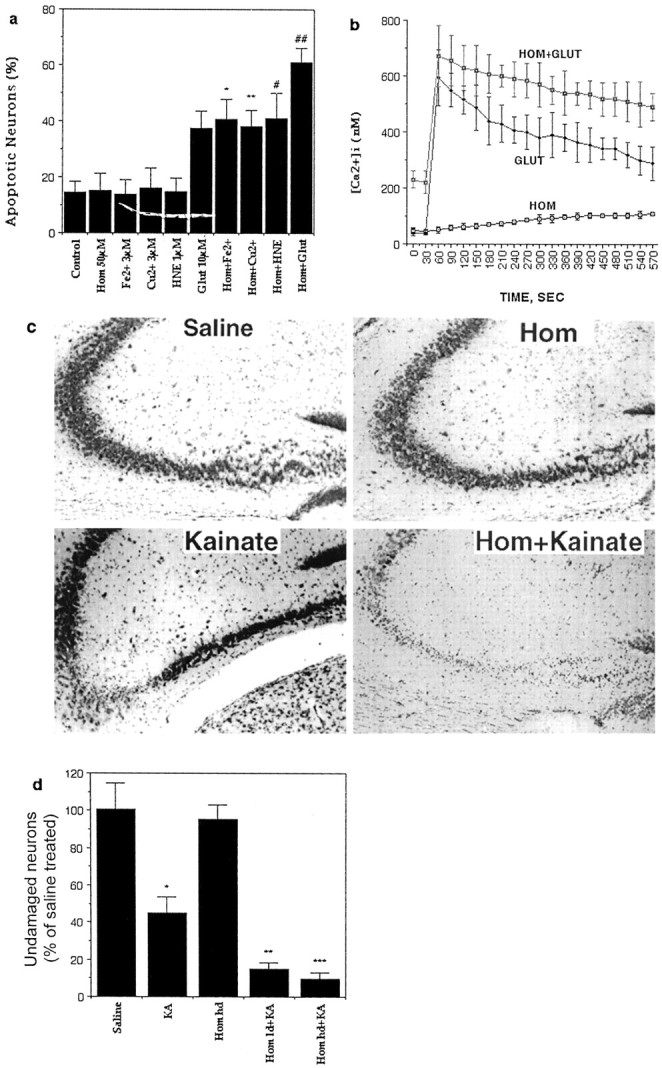
Elevated plasma levels of the sulfur-containing amino acid homocysteine increase the risk for atherosclerosis, stroke, and possibly Alzheimer's disease, but the underlying mechanisms are unknown. We now report that homocysteine induces apoptosis in rat hippocampal neurons. DNA strand breaks and associated activation of poly-ADP-ribose polymerase (PARP) and NAD depletion occur rapidly after exposure to homocysteine and precede mitochondrial dysfunction, oxidative stress, and caspase activation. The PARP inhibitor 3-aminobenzamide (3AB) protects neurons against homocysteine-induced NAD depletion, loss of mitochondrial transmembrane potential, and cell death, demonstrating a requirement for PARP activation and/or NAD depletion in homocysteine-induced apoptosis. Caspase inhibition accelerates the loss of mitochondrial potential and shifts the mode of cell death to necrosis; inhibition of PARP with 3AB attenuates this effect of caspase inhibition. Homocysteine markedly increases the vulnerability of hippocampal neurons to excitotoxic and oxidative injury in cell culture and in vivo, suggesting a mechanism by which homocysteine may contribute to the pathogenesis of neurodegenerative disorders.


Figures

Fig. 1.
Fig. 1.
Homocysteine induces DNA damage and apoptosis in cultured hippocampal neurons. a, Cultures were exposed for 28 hr to either saline (Con) or 250 μmhomocysteine (Hom) and then were stained with the fluorescent DNA-binding dye Hoechst 33342 (top) or were photographed under phase-contrast optics (bottom). Note the nuclear DNA condensation and fragmentation and the damage to neurites in many of the neurons in the culture exposed to homocysteine.b, Cultures were exposed to the indicated concentrations of homocysteine for the indicated time periods, and the percentages of neurons with apoptotic nuclei were quantified. Values are the mean and SD of determinations made in four to six cultures. c,Comet assay analysis of nuclear DNA in neurons in a control culture (left) and a culture that had been exposed for 1 hr to 250 μm homocysteine is shown. Note the comet-like appearance of DNA in the neurons that had been exposed to homocysteine.d, Cultures were exposed to 250 μmhomocysteine for the indicated time periods, and comet assays were performed. Values are the mean and SD of determinations made in four cultures. *p < 0.01 and **p < 0.001 compared with the basal value (ANOVA with Scheffe post hoc tests).
Fig. 2.
Fig. 2.
Involvement of PARP and caspase activation in the neuronal death induced by homocysteine. a, PARP activity levels were measured in hippocampal cells at the indicated time points after exposure to 250 μm homocysteine. *p < 0.05 and **p < 0.01 compared with the basal value. b, Levels of NAD+ were measured at the indicated time points after exposure to 250 μm homocysteine. *p < 0.05 and **p < 0.01 compared with the basal value.c, Cultures were exposed to 250 μmhomocysteine alone or in combination with 5 mm 3AB, and levels of NAD+ were measured 8 hr later. **p < 0.01 compared with the control value and with the value for cultures exposed to 3AB plus homocysteine. d, Levels of caspase-3-like protease activity were measured in hippocampal cells at the indicated time points after exposure to 250 μmhomocysteine. *p < 0.05 compared with the basal value. e, Cultures were exposed for 22 hr to the indicated treatments, and the percentages of neurons with apoptotic nuclei (Hoechst staining) or necrotic membranes (trypan blue staining) were quantified. Cultures were pretreated for 1 hr with either 10 μm zVAD-fmk or 5 mm 3AB or both before exposure to homocysteine. **p < 0.01 compared with the corresponding control value; ##p < 0.01 compared with the corresponding value for cultures exposed to homocysteine alone. f, Levels of p53 immunoreactivity were measured in hippocampal cells at the indicated time points after exposure to 250 μm homocysteine. Values represent the average relative level of p53 immunoreactivity per cell; measurements were made in six cultures (12–15 neurons analyzed/culture). **p < 0.01 compared with the basal value. For each graph (a–f) the values are the mean and SD of determinations made in four to eight cultures; statistical comparisons used ANOVA with Scheffe post hoc tests.
Fig. 3.
Fig. 3.
Homocysteine induces delayed mitochondrial oxidative stress and membrane depolarization that require PARP activation. a, Levels of mitochondrial reactive oxygen species (ROS; DHR fluorescence) were measured in hippocampal neurons at the indicated time points after exposure to 250 μm homocysteine. **p < 0.01 compared with the basal value. b, Mitochondrial transmembrane potential (JC-1 fluorescence) was measured in hippocampal neurons at the indicated time points after exposure to 250 μmhomocysteine. *p < 0.05 and **p < 0.01 compared with the basal value.c, Levels of mitochondrial ROS were measured 5 hr after exposure to 250 μm homocysteine in neurons in control cultures and cultures pretreated for 1 hr with 5 mm 3AB. **p < 0.01 compared with the control value; #p < 0.05 compared with the value for cultures exposed to homocysteine alone. d,Mitochondrial transmembrane potential was measured 18 hr after exposure to 250 μm homocysteine in neurons in control cultures and cultures pretreated for 1 hr with 10 μm zVAD-fmk alone or in combination with 5 mm 3AB. *p< 0.05 and **p < 0.01 compared with the control value; #p < 0.01 compared with the value for cultures exposed to Hom+zVAD. For each graph (a–d) the values are the mean and SD of determinations made in four to six cultures; statistical comparisons used ANOVA with Scheffe post hoc tests.
Fig. 4.
Fig. 4.
Homocysteine sensitizes hippocampal neurons to excitotoxicity and oxidative injury. a, Cultures were exposed for 30 hr to the indicated treatments, and the percentages of neurons with apoptotic nuclei were quantified. Values are the mean and SD of determinations made in four to six cultures. *p < 0.01 and **p < 0.001 compared with the corresponding value for cultures exposed to the oxidative insult or glutamate (Glut) alone (ANOVA with Scheffe post hoc tests). b, Levels of intracellular free Ca2+ were measured at baseline and after exposure to 100 μm glutamate. Cultures were pretreated for 1 hr with vehicle (Glut) or 250 μm homocysteine (Hom+Glut) before exposure to glutamate. Additional cultures were exposed to 250 μmhomocysteine 30 sec after the initial measurement of basal levels of Ca2+. c, Cresyl violet-stained brain sections show the CA3 and hilar region of hippocampi from mice that had received an intrahippocampal injection of the indicated treatments 24 hr previously (kainate, 0.2 μg; homocysteine, 4.3 ng). Note the modest damage to CA3 neurons in the mouse administered kainate alone and the greatly enhanced damage to CA3 and hilar neurons in the mouse receiving homocysteine plus kainate. d, Mice received intrahippocampal injections of the indicated treatments. Twenty-four hours later mice were killed, and the percentages of undamaged neurons in region CA3 of the hippocampus were quantified. Values are the mean and SD of determinations made in six to eight mice.hd, High dose; HNE, 4-hydroxynonenal;KA, kainate; ld, low dose.*p< 0.01 versus saline; **p < 0.01 and ***p < 0.001 versus Homhd.

References

    1. Adamec E, Vonsattel JP, Nixon RA. DNA strand breaks in Alzheimer's disease. Brain Res. 1999;849:67–77. - PubMed
    1. Andersson A, Brattstrom L, Israelsson B, Isaksson A, Hamfelt A, Hultberg B. Plasma homocysteine before and after methionine loading with regard to age, gender, and menopausal status. Eur J Clin Invest. 1992;22:79–87. - PubMed
    1. Bernofsky C, Swan M. An improved cycling assay for nicotinamide adenine dinucleotide. Anal Biochem. 1973;53:452–460. - PubMed
    1. Blount BC, Mack MM, Wehr CM, MacGregor JT, Hiatt RA, Wang G, Wickramasinghe SN, Everson RB, Ames BN. Folate deficiency causes uracil misincorporation into human DNA and chromosome breakage: implication for cancer and neuronal damage. Proc Natl Acad Sci USA. 1997;94:3290–3295. - PMC - PubMed
    1. Blundell G, Jones BG, Rose FA, Tudball N. Homocysteine mediated endothelial cell toxicity and its amelioration. Atherosclerosis. 1996;122:163–172. - PubMed

Publication types

MeSH terms

LinkOut - more resources