Review
. 2000:47:173-215.
doi: 10.1016/s0065-308x(00)47009-0.

Earth observation, geographic information systems and Plasmodium falciparum malaria in sub-Saharan Africa

Affiliations
Review

Earth observation, geographic information systems and Plasmodium falciparum malaria in sub-Saharan Africa

S I Hay et al. Adv Parasitol. 2000.

Abstract

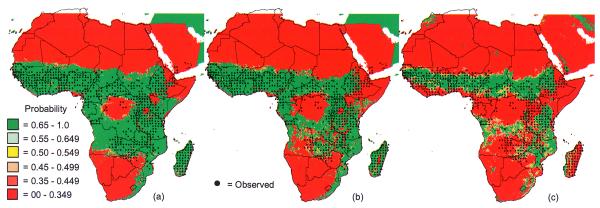
This review highlights the progress and current status of remote sensing (RS) and geographical information systems (GIS) as currently applied to the problem of Plasmodium falciparum malaria in sub-Saharan Africa (SSA). The burden of P. falciparum malaria in SSA is first summarized and then contrasted with the paucity of accurate and recent information on the nature and extent of the disease. This provides perspective on both the global importance of the pathogen and the potential for contribution of RS and GIS techniques. The ecology of P. falciparum malaria and its major anopheline vectors in SSA in then outlined, to provide the epidemiological background for considering disease transmission processes and their environmental correlates. Because RS and GIS are recent techniques in epidemiology, all mosquito-borne diseases are considered in this review in order to convey the range of ideas, insights and innovation provided. To conclude, the impact of these initial studies is assessed and suggestions provided on how these advances could be best used for malaria control in an appropriate and sustainable manner, with key areas for future research highlighted.


Figures

Figure 1
Figure 1
Zones defining different levels of risk of malaria according to the malaria distribution model (Craig et al., 1999): endemic areas in southern Africa (> 0.5), stable transmission areas in the rest of sub-Saharan Africa (>0.2), epidemic-prone areas (>0, <0.2). and negligible malaria risk (<0.5 in southern Africa, 0.0 elsewhere).
Plate 4
Plate 4
Climatic suitability for stable malaria. Fuzzy value: 0, malaria unstable or absent; 1, malaria probably endemic; between 0 and 1, increasing climatic suitability, increasing chance of stable malaria. See Hay et al. (this volume).
Plate 5
Plate 5
Records of the distribution of the six named species of the Anopheles gambiae complex superimposed on a background of total annual rainfall. The addition of ‘sp.’ to An. gambiae and An. quadriannulatus indicates that these taxa include more than one species. See Hay et al. (this volume).
Plate 5
Plate 5
Records of the distribution of the six named species of the Anopheles gambiae complex superimposed on a background of total annual rainfall. The addition of ‘sp.’ to An. gambiae and An. quadriannulatus indicates that these taxa include more than one species. See Hay et al. (this volume).
Plate 6
Plate 6
Predictions of malaria seasonality at 1 × 1 km spatial resolution in Kenya and Uganda (north is to the top of the page). The map shows the number of months for which Plasmodium falciparum malaria transmission is possible, determined by a Normalized Difference Vegetation Index (NDVI) threshold of 0.35. See Hay et al. (this volume).
Plate 7
Plate 7
Average annual incidence of locally transmitted malaria in South Africa from 1987 to 1993. Incidence at province level is very low (a); reporting at district level highlights the four high-risk districts along the northern and eastern borders (b). See Hay et al. (this volume). Closer examination of the two high-risk districts in KwaZulu-Natal at malaria control area (c) and sector (d) level reveals sub-district variability, with higher incidence around the towns of Ndumu, Sihangwane and Jozini, and low incidence along the coast; reporting cases at household level (individual households are shown in (c)) allows higher-resolution examination, for instance on a 2.5 × 2.5 km2 grid (e). See Hay et al. (this volume).
Plate 7
Plate 7
Average annual incidence of locally transmitted malaria in South Africa from 1987 to 1993. Incidence at province level is very low (a); reporting at district level highlights the four high-risk districts along the northern and eastern borders (b). See Hay et al. (this volume). Closer examination of the two high-risk districts in KwaZulu-Natal at malaria control area (c) and sector (d) level reveals sub-district variability, with higher incidence around the towns of Ndumu, Sihangwane and Jozini, and low incidence along the coast; reporting cases at household level (individual households are shown in (c)) allows higher-resolution examination, for instance on a 2.5 × 2.5 km2 grid (e). See Hay et al. (this volume).
Plate 8
Plate 8
The recorded distribution of the brown ear tick Rhipicephalus appendiculatus (crosses) described by discriminant analysis of (a) a single variable, the mean monthly maximum temperature, in Zimbabwe, and (b) two additional variables, the minimum of the monthly NDVI and elevation, in Kenya and Tanzania. See Randolph (this volume). (Reproduced from Rogers and Randolph, 1993.)
Plate 9
Plate 9
The recorded pan-African distribution of the bont tick Amblyomma variegatum (•) described by discriminant analysis of a digital elevation model and remotely sensed variables of NDVI, cold cloud duration and infrared radiation, (a) No clustering, (b) four absence and three presence clusters and (c) five absence and two presence clusters. See Randolph (this volume). (Unpublished maps created by Jonathan Toomer and David Rogers, reproduced from Toomer, 1996.)
Plate 10
Plate 10
(a) Predicted (red) and observed (yellow hatched) pan-European distributions of foci of tick-borne encephalitis (TBE) virus, based on analysis of remotely sensed environmental variables and elevation within the outlined area. TBE virus occurs extensively to the east of this area, in Russia, Belarus, Ukraine and Romania (Immuno, 1997), but is not yet mapped in any detail. High mountain areas (darker green) were excluded from the analysis as the satellite data for them are less reliable because of more frequent cloud contamination. (b) Detail of central Europe taken from (a).

References

    1. Anderson JF, Andreadis TG, Vossbrinck CR, et al. Isolation of West Nile virus from mosquitoes, crows, and a Cooper’s hawk in Connecticut. Science. 1999;286:2331–2333. - PubMed
    1. Anderson RM, May RM. Infectious Diseases of Humans: Dynamics and Control. Oxford University Press; Oxford: 1991a. A framework for discussing the population biology of infectious diseases; pp. 13–23.
    1. Anderson RM, May RM. Infectious Diseases of Humans: Dynamics and Control. Oxford University Press; Oxford: 1991b. Indirectly transmitted microparasites; pp. 374–429.
    1. Aniedu I. Dynamics of malaria transmission near two permanent breeding sites in Baringo District. Indian Journal of Medical Research. 1997;105:206–211. - PubMed
    1. Anonymous . Malaria Areas in the Union of South Africa. Union of South Africa, Department of Public Health; Pretoria: 1938.

Publication types

LinkOut - more resources