. 2000 Oct;74(20):9562-70.
doi: 10.1128/jvi.74.20.9562-9570.2000.

Reovirus-induced G(2)/M cell cycle arrest requires sigma1s and occurs in the absence of apoptosis

Affiliations

Reovirus-induced G(2)/M cell cycle arrest requires sigma1s and occurs in the absence of apoptosis

G J Poggioli et al. J Virol. 2000 Oct.

Abstract

Serotype-specific differences in the capacity of reovirus strains to inhibit proliferation of murine L929 cells correlate with the capacity to induce apoptosis. The prototype serotype 3 reovirus strains Abney (T3A) and Dearing (T3D) inhibit cellular proliferation and induce apoptosis to a greater extent than the prototype serotype 1 reovirus strain Lang (T1L). We now show that reovirus-induced inhibition of cellular proliferation results from a G(2)/M cell cycle arrest. Using T1L x T3D reassortant viruses, we found that strain-specific differences in the capacity to induce G(2)/M arrest, like the differences in the capacity to induce apoptosis, are determined by the viral S1 gene. The S1 gene is bicistronic, encoding the viral attachment protein sigma1 and the nonstructural protein sigma1s. A sigma1s-deficient reovirus strain, T3C84-MA, fails to induce G(2)/M arrest, yet retains the capacity to induce apoptosis, indicating that sigma1s is required for reovirus-induced G(2)/M arrest. Expression of sigma1s in C127 cells increases the percentage of cells in the G(2)/M phase of the cell cycle, supporting a role for this protein in reovirus-induced G(2)/M arrest. Inhibition of reovirus-induced apoptosis failed to prevent virus-induced G(2)/M arrest, indicating that G(2)/M arrest is not the result of apoptosis related DNA damage and suggests that these two processes occur through distinct pathways.


Figures

FIG. 1
FIG. 1
Reovirus inhibits cellular proliferation. Asynchronous, subconfluent monolayers of L929 cells were either mock infected (circles) or infected with T1L (triangles) or T3A (squares) at an MOI of 100 PFU per cell. Cells were harvested at the indicated times postinfection and counted. Cells that excluded trypan blue were scored as viable. Results are presented as the number of viable cells × 105 per ml. The results from a representative experiment of three independent experiments are shown.
FIG. 2
FIG. 2
T3 reovirus induces an increase in the percentage of cells in the G2/M phase of the cell cycle. Asynchronous, subconfluent monolayers of L929 cells were either mock infected (circles) or infected with T1L (triangles), T3A (squares), or T3D (diamonds) at an MOI of 100 PFU per cell. Cells were harvested at the indicated times postinfection, stained with Krishan's stain, and analyzed for DNA content using flow cytometry. Results are presented as the percentage of cells in G2/M phase (A) or G1 phase (B) of the cell cycle. Results of a representative experiment of three independent experiments are shown. (C) L929 cells were synchronized with 1 μM methotrexate and 50 μM adenosine for 16 h. Cells were released using fresh media containing 2 mg of thymidine per ml and either mock infected or infected with T1L or T3A at an MOI of 100 PFU per cell. Cells were harvested at the indicated times postinfection, stained with Krishan's stain, and analyzed for DNA content using flow cytometry. Results are presented as the cell cycle distribution following either mock, T1L, or T3A infection at the indicated times postinfection.
FIG. 2
FIG. 2
T3 reovirus induces an increase in the percentage of cells in the G2/M phase of the cell cycle. Asynchronous, subconfluent monolayers of L929 cells were either mock infected (circles) or infected with T1L (triangles), T3A (squares), or T3D (diamonds) at an MOI of 100 PFU per cell. Cells were harvested at the indicated times postinfection, stained with Krishan's stain, and analyzed for DNA content using flow cytometry. Results are presented as the percentage of cells in G2/M phase (A) or G1 phase (B) of the cell cycle. Results of a representative experiment of three independent experiments are shown. (C) L929 cells were synchronized with 1 μM methotrexate and 50 μM adenosine for 16 h. Cells were released using fresh media containing 2 mg of thymidine per ml and either mock infected or infected with T1L or T3A at an MOI of 100 PFU per cell. Cells were harvested at the indicated times postinfection, stained with Krishan's stain, and analyzed for DNA content using flow cytometry. Results are presented as the cell cycle distribution following either mock, T1L, or T3A infection at the indicated times postinfection.
FIG. 3
FIG. 3
G2/M arrest induced by T3 reovirus is dose dependent. Asynchronous, subconfluent monolayers of L929 cells were either mock infected or infected with T3A at MOIs of 1, 10, and 100 PFU per cell. Cells were harvested at 48 h postinfection, stained with Krishan's stain, and analyzed for DNA content using flow cytometry. Results are presented as the percentage of cells in G2/M phase.
FIG. 4
FIG. 4
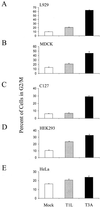
T3 reovirus induces G2/M arrest in murine, canine, and human cells. Asynchronous, subconfluent monolayers of L929 (A), MDCK (B), C127 (C), HEK293 (D), and HeLa (E) cells were either mock infected (white) or infected with T1L (gray) or T3A (black) at an MOI of 100 PFU per cell. Cells were harvested at 48 h postinfection, stained with Krishan's stain, and analyzed for DNA content using flow cytometry. Results are presented as the mean percentage of cells in G2/M phase for three independent experiments. The error bars indicate the standard errors of the mean. A significantly greater percentage of T3A-infected cells were in G2/M than mock-infected cells in all cell lines tested (P < 0.01 to 0.001). A significantly greater percentage of T3A-infected cells were in G2/M than T1L-infected cells in all cell lines tested (P < 0.01 to 0.001) except HeLa. A significantly greater percentage of T1L-infected cells were in G2/M than mock-infected cells in L929 and HEK293 cells (P < 0.001).
FIG. 5
FIG. 5
T3A-induced G2/M arrest phenotype is dominant. L929 cells were either mock infected (white), coinfected with equivalent MOIs of T1L and T3A (the MOI of each virus was 50 PFU per cell) (hatched), or infected with T1L (shaded) or T3A (solid) alone at MOIs of 50 or 100 PFU per cell. L929 cells were harvested at 48 h postinfection and analyzed using flow cytometry. The results are presented as the percentage of cells in the G2/M phase of the cell cycle.
FIG. 6
FIG. 6
Reovirus-induced G2/M arrest requires ς1s. L929 cells were either mock infected (white) or infected with wild-type T3C84 (black) or ς1s-null mutant T3C84-MA (gray) at MOIs of 100, 250, or 1,000 PFU per cell. Cells were harvested 48 h postinfection, stained with Krishan's stain, and analyzed using flow cytometry. The results are presented as the mean percentage of cells in G2/M phase of the cell cycle for six independent experiments at an MOI of 100 and three independent experiments at MOIs of 250 and 1,000. The error bars indicate the standard errors of the mean. A significantly greater percentage of T3C84-infected cells were in G2/M than T3C84-MA-infected cells at each MOI tested (P < 0.001).
FIG. 7
FIG. 7
ς1s expression induces an increase in the percentage of cells in G2/M phase. C127 cells stably transfected with ς1s (BPX-6) or vector control (BPV-12) under the control of the mouse metallothionein promoter were induced with CdCl2, harvested at the indicated times postinduction, and analyzed for DNA content by flow cytometry. The results are presented as the mean percentage of cells in the G2/M phase of the cell cycle for three to six independent experiments. The error bars indicate the standard errors of the mean. The percentage of cells in G2/M was significantly greater in the ς1s-expressing cells than in the vector-control cells at 45 h (P = 0.03, n = 4) and 55 h (P = 0.005, n = 6) postinduction.
FIG. 8
FIG. 8
Inhibitors of reovirus-induced apoptosis do not inhibit reovirus-induced G2/M arrest. (A) Effect of calpain inhibitor PD150606 on T3A-induced G2/M arrest. L929 cells were treated with either 25 μM calpain inhibitor PD150606 or an ethanol control and then either mock infected or infected with T3A at an MOI of 100 PFU per cell. (B) Effect of caspase 3 inhibitor DEVD-CHO on T3A-induced G2/M arrest. HEK293 cells were treated with either 100 μM caspase 3 inhibitor DEVD-CHO or a dimethyl sulfoxide control and then either mock infected or infected with T3A at an MOI of 100 PFU per cell. (C) Effect of anti-TRAIL antibodies on T3A-induced G2/M arrest. HEK293 cells were treated with either 30 μg of an anti-TRAIL antibody per ml or mock treated as a control and then either mock infected or infected with T3A at an MOI of 100 PFU per cell. (D) Effect of NF-κB inhibition on T3A-induced G2/M arrest. HEK293 cells expressing a dominant-negative form of IκB (IκB-ΔN2) to inhibit NF-κB activation or untransfected HEK293 cells were either mock infected or infected with T3A at an MOI of 100 PFU per cell. In all cases, G2/M arrest was assessed 48 h postinfection.

Similar articles

Cited by

References

    1. Advani S J, Brandimarti R, Weichselbaum R R, Roizman B. The disappearance of cyclins A and B and the increase in activity of the G(2)/M-phase cellular kinase cdc2 in herpes simplex virus 1-infected cells require expression of the alpha22/U(S)1.5 and U(L)13 viral genes. J Virol. 2000;74:8–15. - PMC - PubMed
    1. Bartz S R, Rogel M E, Emerman M. Human immunodeficiency virus type 1 cell cycle control: Vpr is cytostatic and mediates G2 accumulation by a mechanism which differs from DNA damage checkpoint control. J Virol. 1996;70:2324–2331. - PMC - PubMed
    1. Braunagel S C, Parr R, Belyavskyi M, Summers M D. Autographa californica nucleopolyhedrovirus infection results in Sf9 cell cycle arrest at G2/M phase. Virology. 1998;244:195–211. - PubMed
    1. Brown E G, Nibert M L, Fields B N. The L2 gene of reovirus serotype 3 controls the capacity to interfere, accumulate deletions and establish persistent infection. In: Compans R W, Bishop D H L, editors. Double-stranded RNA viruses. New York, N.Y: Elsevier; 1983. pp. 275–287.
    1. Ceruzzi M, Shatkin A J. Expression of reovirus p14 in bacteria and identification in the cytoplasm of infected mouse L cells. Virology. 1986;153:35–45. - PubMed

Publication types

LinkOut - more resources