

Structure-based moloney murine leukemia virus reverse transcriptase mutants with altered intracellular direct-repeat deletion frequencies
- PMID: 11000235
- PMCID: PMC112395
- DOI: 10.1128/jvi.74.20.9629-9636.2000
Structure-based moloney murine leukemia virus reverse transcriptase mutants with altered intracellular direct-repeat deletion frequencies
Abstract
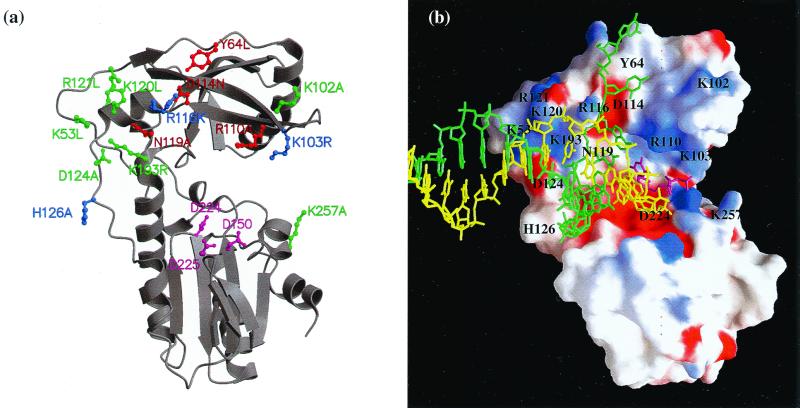
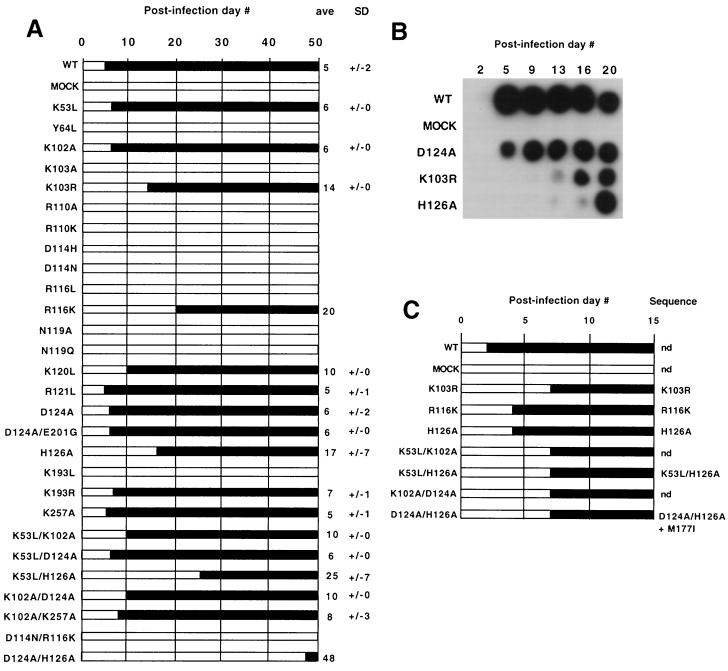
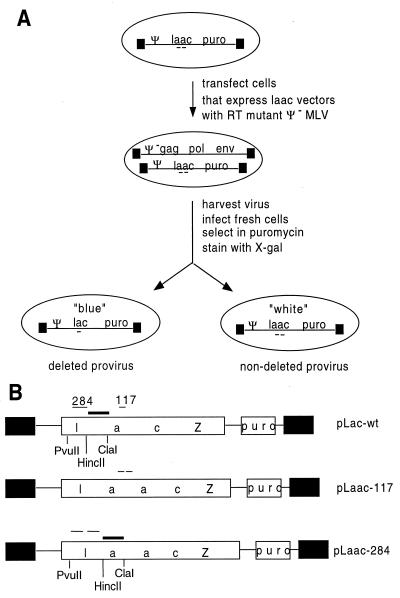
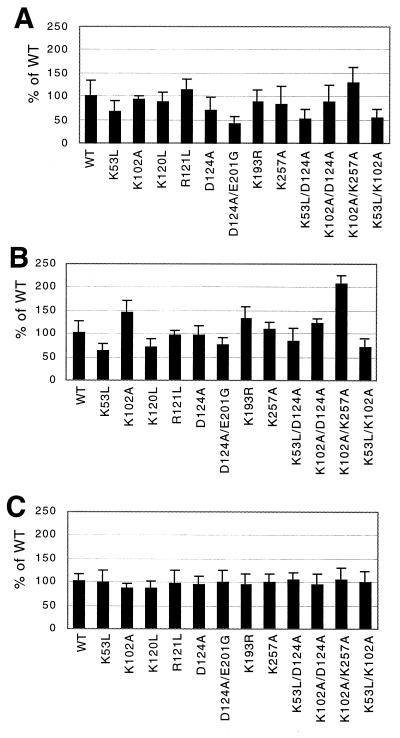
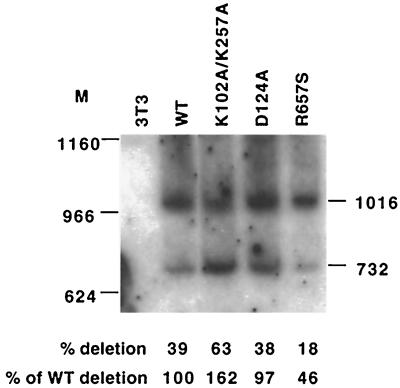
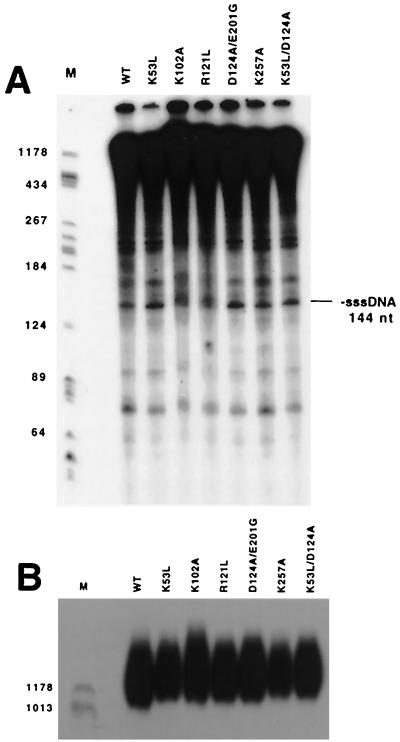
Template switching rates of Moloney murine leukemia virus reverse transcriptase mutants were tested using a retroviral vector-based direct-repeat deletion assay. The reverse transcriptase mutants contained alterations in residues that modeling of substrates into the catalytic core had suggested might affect interactions with primer and/or template strands. As assessed by the frequency of functional lacZ gene generation from vectors in which lacZ was disrupted by insertion of a sequence duplication, the frequency of template switching varied more than threefold among fully replication-competent mutants. Some mutants displayed deletion rates that were lower and others displayed rates that were higher than that of wild-type virus. Replication for the mutants with the most significant alterations in template switching frequencies was similar to that of the wild type. These data suggest that reverse transcriptase template switching rates can be altered significantly without destroying normal replication functions.
Figures
Similar articles
-
RNase H activity is required for high-frequency repeat deletion during Moloney murine leukemia virus replication.J Virol. 2002 Jan;76(1):88-95. doi: 10.1128/jvi.76.1.88-95.2002. J Virol. 2002. PMID: 11739674 Free PMC article.
-
Altering the intracellular environment increases the frequency of tandem repeat deletion during Moloney murine leukemia virus reverse transcription.J Virol. 1999 Oct;73(10):8441-7. doi: 10.1128/JVI.73.10.8441-8447.1999. J Virol. 1999. PMID: 10482596 Free PMC article.
-
Substitution of Asp114 or Arg116 in the fingers domain of moloney murine leukemia virus reverse transcriptase affects interactions with the template-primer resulting in decreased processivity.J Mol Biol. 2001 Jan 12;305(2):341-59. doi: 10.1006/jmbi.2000.4281. J Mol Biol. 2001. PMID: 11124910
-
Frequency of direct repeat deletion in a human immunodeficiency virus type 1 vector during reverse transcription in human cells.Virology. 2001 Aug 1;286(2):475-82. doi: 10.1006/viro.2001.1025. Virology. 2001. PMID: 11485415
-
Mutations of the RNase H C helix of the Moloney murine leukemia virus reverse transcriptase reveal defects in polypurine tract recognition.J Virol. 2002 Aug;76(16):8360-73. doi: 10.1128/jvi.76.16.8360-8373.2002. J Virol. 2002. PMID: 12134040 Free PMC article.
Cited by
-
Moloney murine leukemia virus genomic RNA packaged in the absence of a full complement of wild type nucleocapsid protein.Virology. 2012 Sep 1;430(2):100-9. doi: 10.1016/j.virol.2012.05.003. Epub 2012 May 25. Virology. 2012. PMID: 22633243 Free PMC article.
-
Effects of identity minimization on Moloney murine leukemia virus template recognition and frequent tertiary template-directed insertions during nonhomologous recombination.J Virol. 2007 Nov;81(22):12156-68. doi: 10.1128/JVI.01591-07. Epub 2007 Sep 5. J Virol. 2007. PMID: 17804514 Free PMC article.
-
Template dimerization promotes an acceptor invasion-induced transfer mechanism during human immunodeficiency virus type 1 minus-strand synthesis.J Virol. 2003 Apr;77(8):4710-21. doi: 10.1128/jvi.77.8.4710-4721.2003. J Virol. 2003. PMID: 12663778 Free PMC article.
-
Effects of limiting homology at the site of intermolecular recombinogenic template switching during Moloney murine leukemia virus replication.J Virol. 2001 Dec;75(23):11263-74. doi: 10.1128/JVI.75.23.11263-11274.2001. J Virol. 2001. PMID: 11689606 Free PMC article.
-
Altered error specificity of RNase H-deficient HIV-1 reverse transcriptases during DNA-dependent DNA synthesis.Nucleic Acids Res. 2013 Apr;41(8):4601-12. doi: 10.1093/nar/gkt109. Epub 2013 Feb 26. Nucleic Acids Res. 2013. PMID: 23444139 Free PMC article.
References
-
- Basu A, Basu S, Modak M J. Site-directed mutagenesis of Moloney murine leukemia virus reverse transcriptase: demonstration of lysine 103 in the nucleotide binding site. J Biol Chem. 1990;265:17162–17166. - PubMed
-
- Chowdhury K, Kaushik N, Pandey V, Modak M J. Elucidation of the role of Arg 110 of murine leukemia virus reverse transcriptase in the catalytic mechanism: biochemical characterization of its mutant enzymes. Biochemistry. 1996;35:16610–16620. - PubMed
-
- Coffin J. Retroviridae: the viruses and their replication. In: Fields B N, Knipe D M, Howley P M, et al., editors. Fundamental virology. 3rd ed. Philadelphia, Pa: Lippincott; 1996. pp. 763–843.
-
- Coffin J M. Structure, replication, and recombination of retrovirus genomes: some unifying hypotheses. J Gen Virol. 1979;42:1–26. - PubMed
Publication types
MeSH terms
Substances
Grants and funding
LinkOut - more resources
Full Text Sources
Other Literature Sources
Research Materials
