. 2000 Oct 1;28(19):3733-42.
doi: 10.1093/nar/28.19.3733.

Photoaffinity polyamines: interactions with AcPhe-tRNA free in solution or bound at the P-site of Escherichia coli ribosomes

Affiliations

Photoaffinity polyamines: interactions with AcPhe-tRNA free in solution or bound at the P-site of Escherichia coli ribosomes

I Amarantos et al. Nucleic Acids Res. .

Abstract

Two photoreactive derivatives of spermine, azidobenzamidino (ABA)-spermine and azidonitrobenzoyl (ANB)-spermine, were used for mapping of polyamine binding sites in AcPhe-tRNA free in solution or bound at the P-site of Escherichia coli poly(U)-programmed ribosomes. Partial nuclease digestion indicated that the deep pocket formed by nucleosides of the D-stem and the variable loop, as well as the anticodon stem, are preferable polyamine binding sites for AcPhe-tRNA in the free state. ABA-spermine was a stronger cross-linker than ANB-spermine. Both photoprobes were linked to AcPhe-tRNA with higher affinity when the latter was non-enzymatically bound to poly(U)-programmed ribosomes. In particular, the cross-linking at the TpsiC stem and acceptor stem was substantially promoted. The photolabeled AcPhe-tRNA.poly(U).ribosome complex exhibited moderate reactivity towards puromycin. The attachment of photoprobes to AcPhe-tRNA was mainly responsible for this defect. A more complicated situation was revealed when the AcPhe-tRNA.poly(U).ribosome complex was formed in the presence of translation factors; the reactivity towards puromycin was stimulated by irradiating such a complex in the presence of photoprobes at 50 microM, with higher concentrations being inhibitory. The stimulatory effect was closely related with the binding of photoprobes to ribosomes. The results are discussed on the basis of possible AcPhe-tRNA conformational changes induced by the incorporation of photoprobes.


Figures

Figure 1
Figure 1
Chemical structures of ANB-spermine and ABA-spermine.
Figure 2
Figure 2
Kinetics of photoincorporation of ANB-spermine and ABA-spermine into AcPhe-tRNA. Purified AcPhe-tRNA (363 pmol) was incubated in the dark with 0.6 mM ABA-spermine (open circles) or ANB-spermine (solid circles) in irradiation buffer (50 mM HEPES–KOH pH 7.2, 6 mM magnesium acetate, 100 mm NH4Cl) at 25°C for 10 min, and then was irradiated at 300 and 366 nm, respectively. Dashed lines, photoprobe incorporation in the presence of excess spermine (non-specific binding).
Figure 3
Figure 3
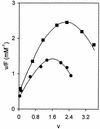
Scatchard plot of ANB-spermine or ABA-spermine photoincorporation into AcPhe-tRNA. Purified AcPhe-tRNA was photolabeled with varying concentrations of ANB-spermine (circles) or ABA-spermine (squares), as indicated in Figure 2. F, the concentration of free photoprobe; v, pmoles of photoprobe bound per pmol of AcPhe-tRNA.
Figure 4
Figure 4
ANB-spermine photoincorporation into AcPhe-tRNA at various concentrations of photoprobe. Circles, specific binding; squares, photoincorporation in the simultaneous presence of excess spermine.
Figure 5
Figure 5
Gel electrophoretic fractionation of products from the enzymatic cleavage of AcPhe-tRNA, free or bound at the ribosomal P-site and photolabeled with ANB-spermine. (A) AcPhe-tRNA photolabeled with 50 µM (lanes 6, 7, 8 and 9) or with 300 µM ANB-spermine (lanes 10, 11, 12 and 13), was deacylated, 3′-end-labeled with [5′-32P]pCp and digested with RNase T1 (lanes 6 and 10), U2 (lanes 7 and 11), PhyM (lanes 8 and 12) and RNase from B.cereus (lanes 9 and 13); lanes 1, 2, 3 and 4 correspond to AcPhe-tRNA non-photolabeled, but digested with RNases T1, U2, PhyM and RNase from B.cereus, respectively; lane 5, alkaline hydrolysis ladder. (B) Complex C was photolabeled with 50 µM (lanes 6, 7, 8 and 9) or with 300 µM ANB-spermine (lanes 10, 11, 12 and 13). The bound AcPhe-tRNA at the P-site was isolated and treated as described in (A). (C) Differences in the protection patterns of AcPhe-tRNA, free or bound at the P-site, and photolabeled with 300 µM ANB-spermine. The relative intensities were calculated according to Dabrowski et al. (27). Briefly, the intensities of all G bands obtained from native AcPhe-tRNA in solution were determined relative to that of G10 (vertical comparison). Likewise, C43, A14 and U50 were the reference bands for all Cs, As and Us, respectively. The intensity of a band of photolabeled AcPhe-tRNA, free or bound at the P-site, relative to the corresponding band of native tRNA (horizontal comparison) was multiplied by the value derived from the vertical scanning of native tRNA. The result of multiplication gives the intensity of this band of photolabeled AcPhe-tRNA relative to the reference band of native AcPhe-tRNA. Red, positions of P-site bound AcPhe-tRNA where the respective relative intensity was <30% that of the corresponding band of the tRNA in solution (strongly interactive nucleosides with ANB-spermine); blue, nucleosides with diminished accessibility (relative intensity >200%); yellow, positions with no difference in the accessibility; green, nucleosides in both free and P-site bound AcPhe-tRNA, non-interactive with ANB-spermine; gray, not determinable positions. The data were taken from (A) and (B).
Figure 5
Figure 5
Gel electrophoretic fractionation of products from the enzymatic cleavage of AcPhe-tRNA, free or bound at the ribosomal P-site and photolabeled with ANB-spermine. (A) AcPhe-tRNA photolabeled with 50 µM (lanes 6, 7, 8 and 9) or with 300 µM ANB-spermine (lanes 10, 11, 12 and 13), was deacylated, 3′-end-labeled with [5′-32P]pCp and digested with RNase T1 (lanes 6 and 10), U2 (lanes 7 and 11), PhyM (lanes 8 and 12) and RNase from B.cereus (lanes 9 and 13); lanes 1, 2, 3 and 4 correspond to AcPhe-tRNA non-photolabeled, but digested with RNases T1, U2, PhyM and RNase from B.cereus, respectively; lane 5, alkaline hydrolysis ladder. (B) Complex C was photolabeled with 50 µM (lanes 6, 7, 8 and 9) or with 300 µM ANB-spermine (lanes 10, 11, 12 and 13). The bound AcPhe-tRNA at the P-site was isolated and treated as described in (A). (C) Differences in the protection patterns of AcPhe-tRNA, free or bound at the P-site, and photolabeled with 300 µM ANB-spermine. The relative intensities were calculated according to Dabrowski et al. (27). Briefly, the intensities of all G bands obtained from native AcPhe-tRNA in solution were determined relative to that of G10 (vertical comparison). Likewise, C43, A14 and U50 were the reference bands for all Cs, As and Us, respectively. The intensity of a band of photolabeled AcPhe-tRNA, free or bound at the P-site, relative to the corresponding band of native tRNA (horizontal comparison) was multiplied by the value derived from the vertical scanning of native tRNA. The result of multiplication gives the intensity of this band of photolabeled AcPhe-tRNA relative to the reference band of native AcPhe-tRNA. Red, positions of P-site bound AcPhe-tRNA where the respective relative intensity was <30% that of the corresponding band of the tRNA in solution (strongly interactive nucleosides with ANB-spermine); blue, nucleosides with diminished accessibility (relative intensity >200%); yellow, positions with no difference in the accessibility; green, nucleosides in both free and P-site bound AcPhe-tRNA, non-interactive with ANB-spermine; gray, not determinable positions. The data were taken from (A) and (B).
Figure 6
Figure 6
Relative electrophoretic mobilities of tRNAPhe species on native 8% polyacrylamide gel. Left panel: complex C was photolabeled with 300 µM ABA-spermine. AcPhe-tRNA bound at the P-site of this ribosomal complex was deacylated by puromycin, extracted and labeled at the 3′-end with [5′-32P]pCp. One-half of the labeled tRNAPhe was incubated at 37°C for 20 min under native buffer conditions (lane 2), whereas the second half was denatured by heating to 90°C for 15 min (lane 4) prior to gel electrophoresis. Lanes 1 and 3 correspond to AcPhe-tRNA isolated from non-photolabeled complex C, and treated as above. Right panel: bands of lanes 1 and 2, magnified.
Figure 7
Figure 7
Kethoxal footprinting of native or photolabeled AcPhe-tRNA with ABA-spermine. (A) Bar graphs indicating normalized kethoxal footprinting. Native AcPhe-tRNA (open bars) or photolabeled with 300 µM ABA-spermine (solid bars), free or bound at the P-site of poly(U)-programmed ribosomes, was treated with kethoxal for 50 min under native conditions. The AcPhe-tRNA was isolated, deacylated and 3′-end-labeled with [5′-32P]pCp. The modification sites by kethoxal were analyzed by T1 partial digestion and gel electrophoresis. The relative intensities were calculated according to Dabrowski et al. (27). Bands G27–30 could not be resolved and were treated as one band. (B) Differences in the kethoxal footprinting patterns of P-site bound AcPhe-tRNA, native or photolabeled with ABA-spermine. Red, guanosines where the respective relative intensities of the two species of AcPhe-tRNA, native or photolabeled with ABA-spermine, differed at least by a factor of two; yellow, no differences according to the above criterion; gray, positions not determinable. The data were taken from (A).

Similar articles

Cited by

References

    1. Schreier A.A. and Schimmel,P.R. (1975) J. Mol. Biol., 93, 323–329. - PubMed
    1. Quigley G.J., Teeter,M.M. and Rich,A. (1978) Proc. Natl Acad. Sci. USA, 75, 64–68. - PMC - PubMed
    1. Holbrook S.R., Sussman,J.L., Warrant,R.W. and Kim,S.-H. (1978) J. Mol. Biol., 123, 631–660. - PubMed
    1. Garcia A., Giegé,R. and Behr,J.-P. (1990) Nucleic Acids Res., 18, 89–95. - PMC - PubMed
    1. Vlassov V.V., Zuber,G., Felden,B., Behr,J.-P. and Giegé,R. (1995) Nucleic Acids Res., 23, 3161–3167. - PMC - PubMed

Publication types

MeSH terms