. 2000 Sep;21(8):1441-9.

Dynamic CT perfusion imaging of acute stroke

Affiliations

Dynamic CT perfusion imaging of acute stroke

T E Mayer et al. AJNR Am J Neuroradiol. 2000 Sep.

Abstract

Background and purpose: Because cerebral perfusion imaging for acute stroke is unavailable in most hospitals, we investigated the feasibility of a method of perfusion scanning that can be performed rapidly during standard cranial CT. Our aim was to identify the scanning parameters best suited to indicate tissue at risk and to measure a perfusion limit to predict infarction.

Methods: Seventy patients who had suffered stroke and had undergone cranial CT 0.5 to 12 hours (median, 3.75 hr) after the onset of symptoms participated in the study. While undergoing conventional CT, each patient received a bolus of iodinated contrast medium. Maps of time to peak (TTP), cerebral blood volume (CBV), and CBF were calculated from the resulting dynamically enhanced scans. These perfusion images were compared with follow-up CT scans or MR images showing the final infarctions.

Results: CBF maps predicted the extent of cerebral infarction with a sensitivity of 93% and a specificity of 98%. In contrast, CBV maps were less sensitive and TTP maps were less specific and also showed areas of collateral flow. Infarction occurred in all of the patients with CBF reduction of more than 70% and in half of the patients with CBF reduction of 40% to 70%.

Conclusion: Dynamic CT perfusion imaging safely detects tissue at risk in cases of acute stroke and is a feasible method for any clinic with a third-generation CT scanner.


Figures
<sc>fig</sc> 1.
fig 1.
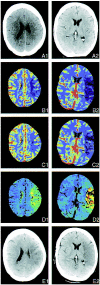
Two perfusion sections in a case of left MCA occlusion. Three hours before undergoing the examination, this 61-year-old woman experienced acute right hemiplegia and global aphasia during coronary angiography. A, Early conventional CT scans appear normal, with no signs of swelling or discrete cortical hypodensity. B, CBF maps show flow reduction in nearly the whole cortical territory of the left MCA. Temporal (B2), severe; parietal (B1), moderate to severe. Note that there is a mismatch with the ECTS (color code: red, blood vessels; green, normal cortex; blue, normal white matter; violet, low flow area). C, CBV maps also show ischemia, although less clearly in the central parietal region because of decreased contrast (color code: red, blood vessels; green, normal cortex; blue, normal white matter; violet, low flow area). D, TTP concentration of contrast enhancement maps show time delay in the cortical territory of the left MCA and artifact in areas where no peak is discernible (color code: blue, segmented blood vessels, normal cortex; dark green, normal white matter; light green, yellow, and red, low flow area). E, Follow-up CT scan, obtained 1 day after stroke, shows infarction in the former ischemic portion of the cortical territory of the MCA. Temporal (B2), complete; central/parietal (B1), patchy.
<sc>fig</sc> 2.
fig 2.
Three perfusion sections. Occlusion of a left MCA branch and of the ipsilateral ICA. This 62-year-old man was admitted with right hemiparesis and aphasia 8 hours after the onset of symptoms. The color-coding is similar to that used in figure 1. A, Early conventional CT scans appear normal, although retrospectively, a discrete hypodense area can be seen in the cortex (A2). B, CBF maps show severe flow reduction in the fronto-opercular territory of the left MCA. C, CBV maps show the ischemic region to be less pronounced and indicate a 10% increase in blood volume in the surrounding cortex, which compensated for the reduced flow velocity in the territory of the left carotid artery. D, TTP concentration of contrast enhancement maps show time delay not only in the ischemic zone but also in the territories of the entire left MCA and anterior cerebral artery due to occlusion of the ICA, as revealed by sonography. Acute left carotid artery occlusion might have led to embolization in a frontal branch of the MCA. E, Follow-up CT scans, obtained 3 days after stroke, show a small infarct representing the former ischemic area of the frontal cortical territory of the MCA (red arrowheads).

Similar articles

Cited by

References

    1. Hacke W, Kaste M, Fieschi C, et al. Randomised double-blind placebo-controlled trial of thrombolytic therapy with intravenous alteplase in acute ischaemic stroke (ECASS II): second European Australasian Acute Stroke Study Investigators. Lancet 1998;352:1245-1251 - PubMed
    1. The National Institute of Neurological Disorders and Stroke rTTPA Stroke Study Group Tissue plasminogen activator for acute ischemic stroke. N Engl J Med 1995;333:1581-1587 - PubMed
    1. Hacke W, Kaste M, Fieschi C, et al. Intravenous thrombolysis with recombinant tissue plasminogen activator for acute hemispheric stroke. The European Cooperative Acute Stroke Study. JAMA 1995;274:1017-1025 - PubMed
    1. Kaps M, Link A. Transcranial sonographic monitoring during thrombolytic therapy. AJNR Am J Neuroradiol 1998;19:758-760 - PMC - PubMed
    1. Wildermuth S, Knauth M, Brandt T, Winter R, Sartor K, Hacke W. Role of CT angiography in patient selection for thrombolytic therapy in acute hemispheric stroke. Stroke 1998;29:935-938 - PubMed

MeSH terms