. 2000 Oct;20(20):7450-9.
doi: 10.1128/MCB.20.20.7450-7459.2000.

Tumor suppressor p53 is required to modulate BRCA1 expression

Affiliations

Tumor suppressor p53 is required to modulate BRCA1 expression

P Arizti et al. Mol Cell Biol. 2000 Oct.

Abstract

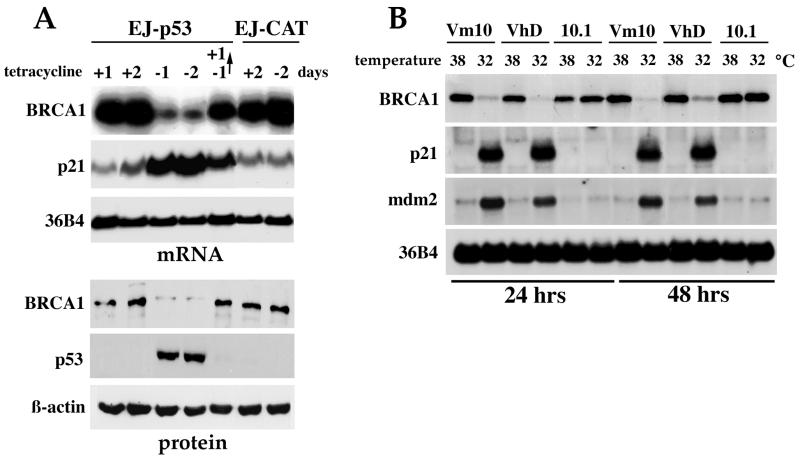
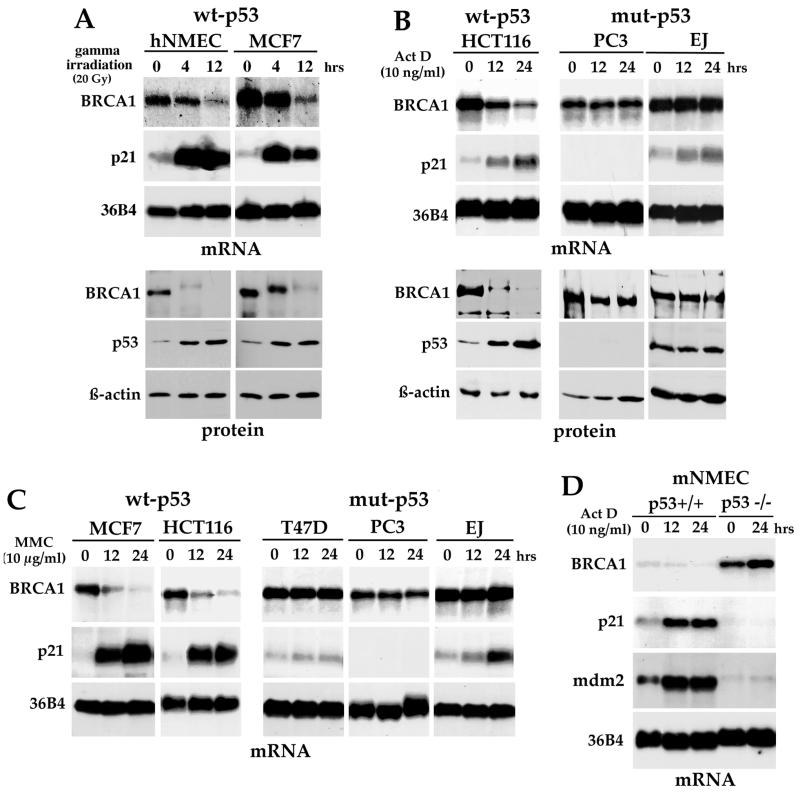
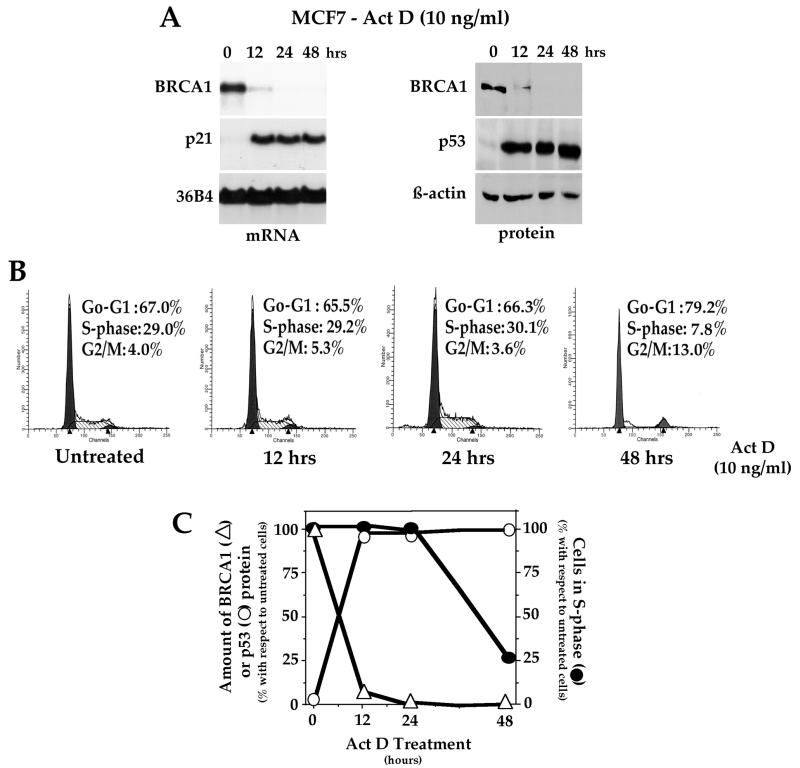
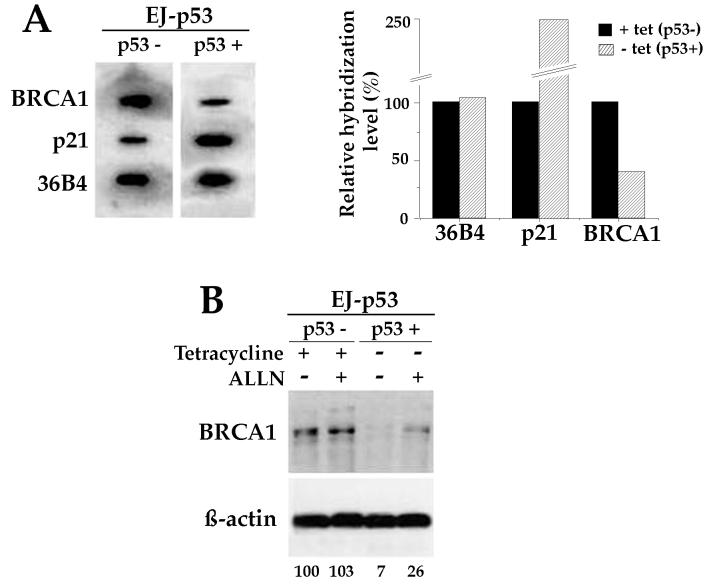
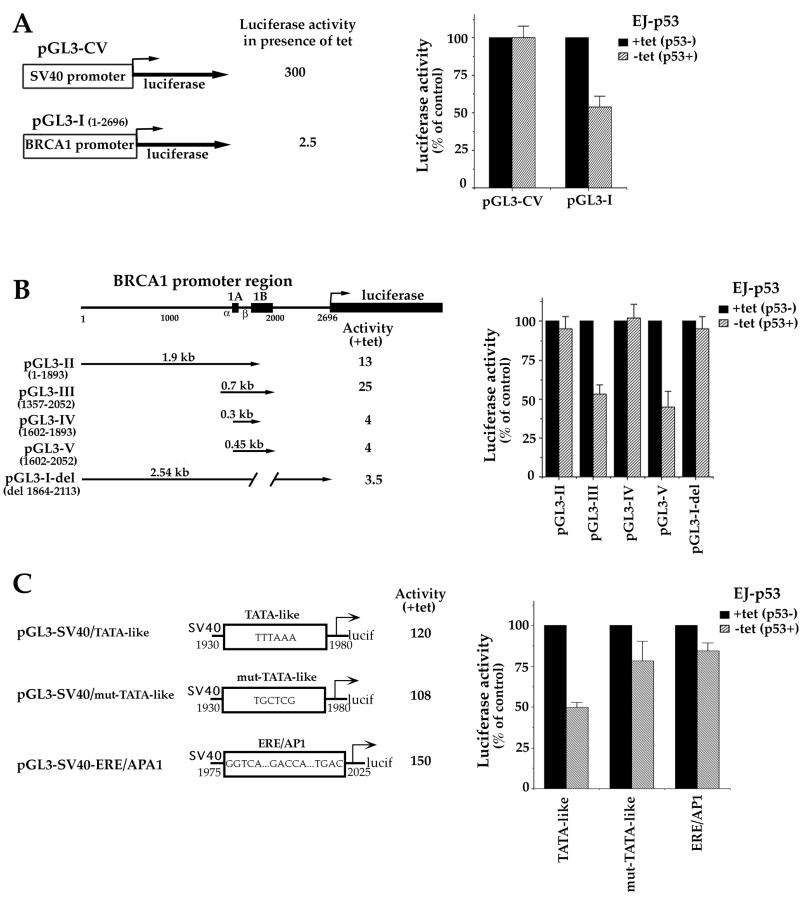
Individuals carrying mutations in BRCA1 or p53 genes are predisposed to a variety of cancers, and both tumor suppressor genes have been implicated in DNA damage response pathways. We have analyzed a possible functional link between p53 and BRCA1 genes. Here we show that BRCA1 expression levels are down-regulated in response to p53 induction in cells that undergo either growth arrest, senescence, or apoptosis. Physiological stimuli, such as exposure to DNA-damaging agents, also result in negative regulation of BRCA1 levels in a p53-dependent manner prior to causing cell cycle arrest. Nuclear run-on experiments and luciferase reporter assays demonstrate that the changes in BRCA1 expression are mainly due to transcriptional repression induced by p53. In conclusion, the data show that BRCA1 expression levels are controlled by the presence and activity of wild-type p53 and suggest the existence of an intracellular p53/BRCA1 pathway in the response of cells to stress conditions.


Figures

FIG. 1
FIG. 1
Down-regulation of BRCA1 by wt p53 overexpression. (A) Repression of BRCA1 mRNA and protein following p53 induction in a tet-regulated system (EJ-p53). RNA and protein extracts were collected at different time points from EJ-p53 cells grown in the presence (+) or absence (−) of tet. In lane −1→+1, cells were grown in the absence of tet for 1 day to allow expression of p53, and then tet was added for another day before RNA and protein were collected. The Northern blot was consecutively hybridized with probes for BRCA1, p21, and 36B4. Western blotting was performed, and blots were immunoblotted with BRCA1 (antibody Ab17F8; GeneTex), p53, and β-actin antibodies. EJ-CAT cells were used as the negative control. (B) Temperature shift induces decreased BRCA1 mRNA levels in cell lines containing a temperature-sensitive p53 mutant (Vm10 and VhD). The parental murine cell line 10.1, which is null for p53, does not show down-regulation of BRCA1 following the temperature shift.
FIG. 2
FIG. 2
Decrease of BRCA1 expression in response to DNA damage requires wt p53. (A) Northern and Western blot analysis of BRCA1 expression following gamma irradiation. hNMEC and MCF7 cells were exposed to 20 Gy of gamma irradiation, and RNA or total proteins were collected at the indicated times following irradiation. After DNA damage exposure, the BRCA1 protein mobility was retarded and then the protein levels decreased. BRCA1 mRNA expression was also reduced. Western blots were immunoblotted with BRCA1 antibody Ab17F8 (GeneTex). (B) Down-regulation of BRCA1 expression in wt p53 cell lines following Act D treatment. A human colon cancer cell line containing wt p53 (HCT116 cells) and two other cell lines containing mutant (mut) p53 (PC3 and EJ) were treated for different time periods with 10 ng of Act D/ml, and then RNA and protein were collected. In this case, Western blots were immunoblotted with BRCA1 Ab1 from Oncogene (clone MS110). (C) Northern blot analysis of BRCA1 in several cell lines following treatment with MMC (10 μg/ml). BRCA1 expression levels were reduced only in the wt p53 cell lines. (D) Enhanced basal levels of BRCA1 in p53−/− cells compared to those in p53+/+ cells. mNMEC from p53 knockout mice or their wt equivalent were isolated and treated with Act D for different time periods; then Northern blot analysis was performed. p53 null cells do not reduce their BRCA1 expression levels in response to Act D treatment.
FIG. 3
FIG. 3
BRCA1 down-regulation in response to DNA damage occurs prior to cell cycle arrest. MCF7 cells were treated with 10 ng of Act D/ml, and then RNA and proteins were prepared and cell cycle analysis was performed at the indicated time points (0, 12, 24, and 48 h). (A) Reduction of BRCA1 expression following DNA damage as shown by Northern and Western blot analysis (Ab1-MS110 [Oncogene] was used to detect BRCA1 protein). (B) Cell cycle analysis of Act D-treated MCF7 cells was performed by FACS. The percentage of cells in each phase of the cell cycle after DNA damage exposure is indicated. No major changes were observed for the first day of treatment. Exposure to Act D for 48 h showed a significant reduction of cells in S phase, but no apoptotic nuclei were observed (data not shown). (C) Summary of the time courses of BRCA1 and p53 expression changes following DNA damage. Data in panels A and B were quantified, and the values obtained for the treated cells with respect to the untreated cells were represented in a graph form. Δ, percentage of BRCA1 protein level; ○, percentage of p53 protein level following Act D treatment; ●, percentage of the cells remaining in S phase after Act D treatment.
FIG. 4
FIG. 4
Transcriptional repression of BRCA1 by p53. (A) Nuclear run-on analysis using [α-32P]UTP-labeled nuclei from EJ-p53 cells grown in the presence of tet or in the absence of tet for 24 h (left). Filters used for hybridization contained 300 ng of purified cDNA inserts from BRCA1, p21, and 36B4. Quantification of nuclear run-on data relative to those for EJ-p53 cells grown in the presence of tet is shown at the right. BRCA1 transcription is significantly reduced in the presence of p53. (B) BRCA1 protein is destabilized. BRCA1 protein accumulates after inhibition of proteases when p53 is induced. EJ-p53 cells were cultured in the presence or absence of tet and treated with the protease inhibitor ALLN (100 μM) for 24 h. BRCA1 protein was then analyzed from cell extracts by Western blotting using BRCA1 antibody Ab17F8 from GeneTex, and the BRCA1 bands were quantified using IPLab gel software. Data obtained from that quantification, relative to the basal BRCA1 level in the absence of p53, are shown at the bottom.
FIG. 5
FIG. 5
Analysis of the BRCA1 promoter region(s) necessary to confer p53-mediated BRCA1 transcriptional repression. (A) Transcriptional repression of the BRCA1 promoter by p53. (Left) Schematic diagram of the entire 2.7-kb BRCA1 promoter sequence cloned upstream of the luciferase reporter gene in the pGL3-basic vector (construct pGL3-I). pGL3-CV, which contains the luciferase reporter gene under the control of the SV40 promoter, was drawn for comparison purposes and used as a control. Luciferase activities obtained for each construct in EJ-p53 cells in the presence of tet were calculated relative to that for the pGL3-basic vector (whose activity was arbitrarily defined as 1). (Right) Luciferase activities obtained following transient transfection of the constructs. EJ-p53 cells were transiently transfected with either pGL3-CV or pGL3-I vector and incubated for 36 h in the presence (p53−) or absence (p53+) of tet. The pRSV-lacZ plasmid was cotransfected with each sample and used to normalize changes in the transfection efficiency. The y axis represents the relative luciferase activity after normalization with respect to EJ-p53 cells grown in the presence of tet, with no p53, for each construct. (B) A 160-bp sequence within the BRCA1 gene confers transcriptional repression. (Left) Schematic diagram showing the deletion constructs of the BRCA1 promoter cloned upstream of the luciferase reporter gene in the pGL3-basic vector. Solid boxes, BRCA1 exons 1A and 1B and the luciferase gene; promoters α and β are also marked. pGL3-II to pGL3-V, several fragments of pGL3-I, as indicated by the numbering and arrows; numbering of the constructs was done as described previously (63); pGL3-I-del, construct in which the sequence from bp 1864 to 2113 has been removed from the BRCA1 gene. All mutant promoters were active in EJ-p53 cells grown in the presence of tet. (Right) Relative luciferase activities obtained following transient transfection of those constructs in the presence or absence of tet. Transfection and activity measurements were done as indicated for panel A. Mutant constructs containing the BRCA1 sequence from bp 1893 to 2052 were repressed by p53. (C) Dissection of the bp 1893 to 2052 region of the BRCA1 gene. A 50-bp region including a BRCA1 TATA-like sequence (TTTAAA-containing sequence) under the control of the SV40 promoter causes a 50% decrease in luciferase activity following p53 induction, while its mutation reverses BRCA1 repression by p53.

References

    1. Agarwal M L, Taylor W R, Chernov M V, Chernova O B, Stark G R. The p53 network. J Biol Chem. 1998;273:1–4. - PubMed
    1. Ausubel F M, Brent R, Kingston R E, Moore D D, Seidman J G, Smith J A, Struhl K. Identification of newly transcribed RNA. In: Ausubel F M, Brent R, Kingston R E, Moore D D, Seidman J G, Smith J A, Struhl K, editors. Current protocols in molecular biology. Vol. 1. New York, N.Y: John Wiley & Sons, Inc.; 1994. pp. 4.10.1–4.10.7.
    1. Band V, Sager R. Distinctive traits of normal and tumor-derived human mammary epithelial cells expressed in a medium that supports long-term growth of both cell types. Proc Natl Acad Sci USA. 1989;86:1249–1253. - PMC - PubMed
    1. Brawerman G, Belasco J G. Control of messenger RNA stability. San Diego, Calif: San Diego Academic Press; 1993.
    1. Castilla L H, Couch F J, Erdos M R, Hoskins K F, Calzone K, Garber J E, Boyd J, Lubin M B, Deshano M L, Brody L C, et al. Mutations in the BRCA1 gene in families with early-onset breast and ovarian cancer. Nat Genet. 1994;8:387–391. - PubMed

Publication types