. 2000 Oct;20(20):7826-37.
doi: 10.1128/MCB.20.20.7826-7837.2000.

A novel AP-1 element in the CD95 ligand promoter is required for induction of apoptosis in hepatocellular carcinoma cells upon treatment with anticancer drugs

Affiliations

A novel AP-1 element in the CD95 ligand promoter is required for induction of apoptosis in hepatocellular carcinoma cells upon treatment with anticancer drugs

S T Eichhorst et al. Mol Cell Biol. 2000 Oct.

Abstract

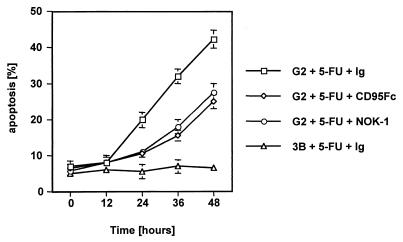
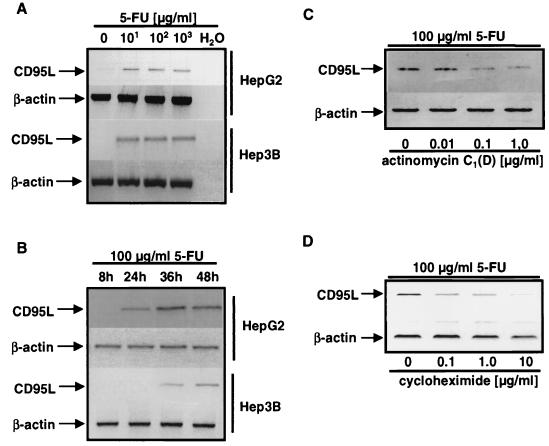
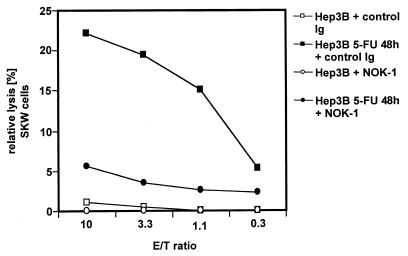
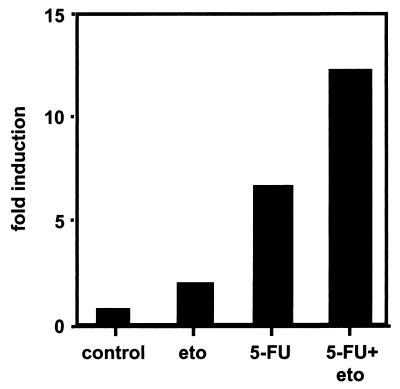
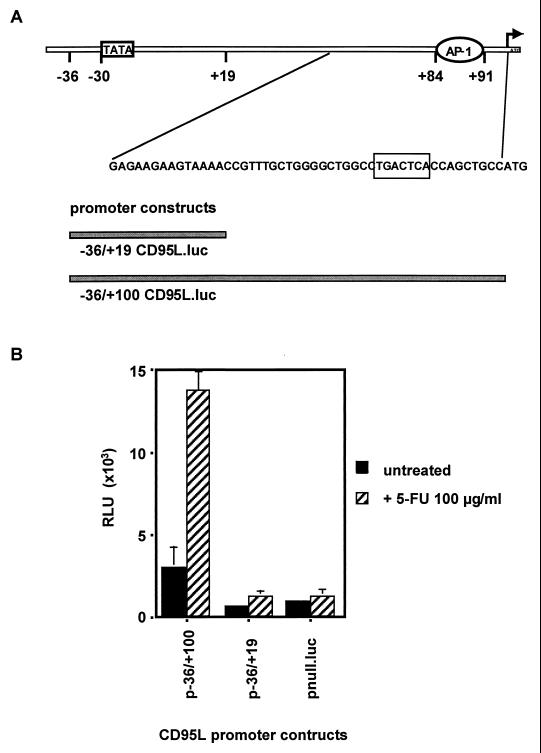
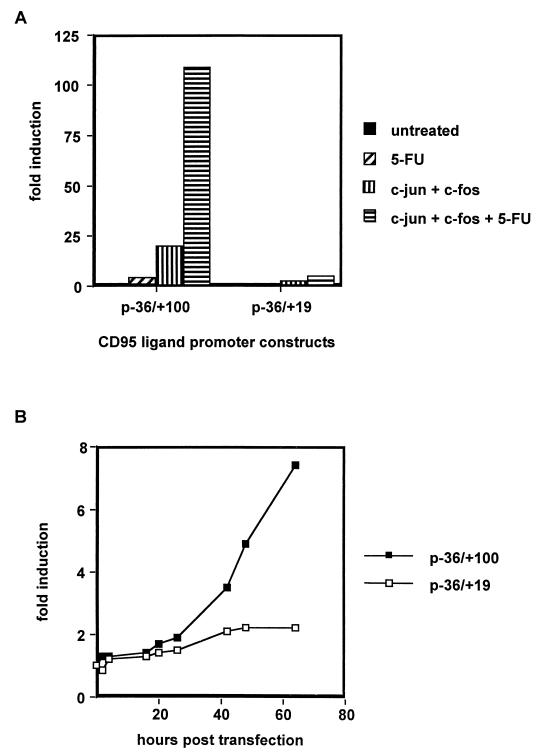
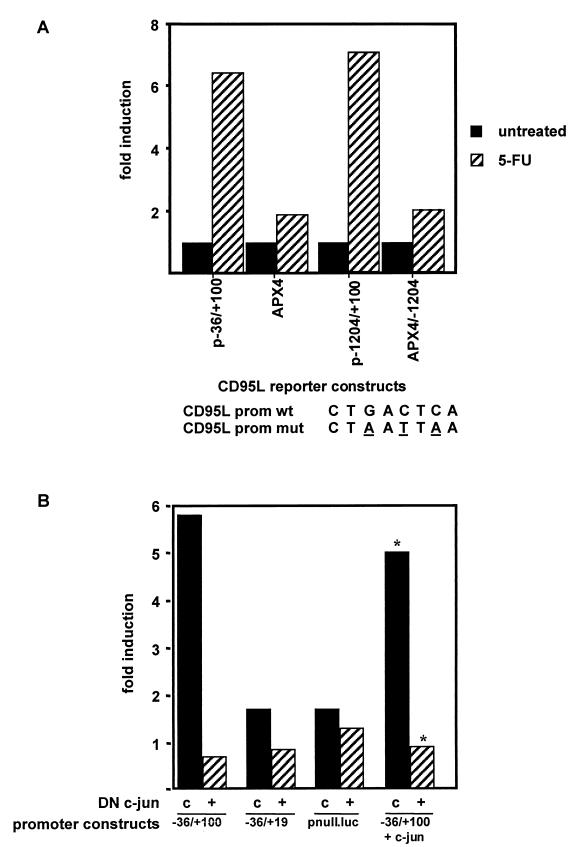
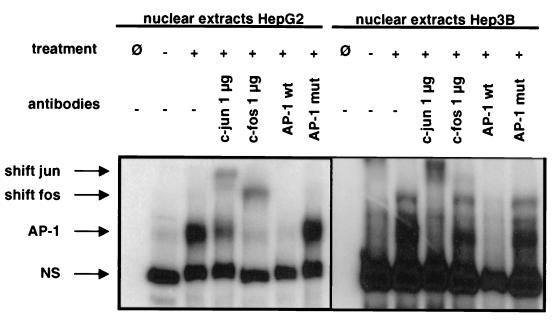
The CD95 (also called APO-1 or Fas) system plays a major role in the induction of apoptosis in lymphoid and nonlymphoid tissues in response to a variety of extracellular signals, including chemotherapeutic drugs. Here we report that the CD95 ligand (CD95L) is upregulated in hepatoma cells upon treatment with antineoplastic drugs. Upregulation by different chemotherapeutic drugs is functionally relevant for drug-induced apoptosis and is mediated by transcriptional mechanisms. The MEKK1/JNKK pathway and a novel AP-1 element in the CD95L promoter downstream of the TATA box are required for CD95L upregulation. Thus, understanding the mechanisms of CD95-mediated apoptosis through CD95L upregulation upon treatment of hepatocellular carcinomas with chemotherapeutic drugs may contribute to the improvement of anticancer chemotherapy.


Figures

FIG. 1
FIG. 1
5-FU causes CD95-mediated apoptosis in HepG2 but not in Hep3B cells. HepG2 or Hep3B cells were grown to near confluence and then treated with 100 μg of 5-FU/ml for the indicated time periods in the presence of either an isotype-matched control antibody (Ig) or the anti-CD95L neutralizing antibody NOK-1 (50 μg/ml). The same experiment was performed with the inclusion of CD95-Fc (50 μg/ml). Apoptosis was determined by propidium iodide exclusion and FSC/SSC measurement. Data represent the mean with standard deviation from triplicate samples. Two experiments with a similar outcome were performed.
FIG. 2
FIG. 2
CD95L mRNA is induced following stimulation with anticancer drugs, and the induction is regulated on the transcriptional level. PCR analysis of CD95L mRNA in HepG2 and Hep3B cells is shown. Total RNA was extracted and RT-PCR was performed as described in Materials and Methods. (A) HepG2 or Hep3B cells were incubated with the indicated concentrations of 5-FU for 36 h. (B) HepG2 or Hep3B cells were incubated with 100 μg of 5-FU/ml for the indicated time periods. (C and D) 5-FU (100 μg/ml) was given to HepG2 cells for 48 h, and either the transcriptional inhibitor actinomycin C1(D) (C) or the translational inhibitor cycloheximide (D) was added at the indicated concentrations.
FIG. 3
FIG. 3
Treatment of malignant liver cells with chemotherapeutic drugs leads to upregulation of functional CD95L. A 51Cr-release assay with Hep3B cells as effectors and SKW6.4 cells as targets is depicted. Hep3B cells were grown in 96-well plates and treated with 5-FU. After 48 h, the chemotherapeutic drugs were removed from the culture medium and 51Cr-labeled SKW6.4 cells were added either with a control antibody or with the anti-CD95L antibody NOK-1. Following overnight incubation, the supernatants were measured in a gamma counter. The relative lysis was calculated as indicated in Materials and Methods. E/T is the ratio between effector and target cells. Each concentration was done in triplicate. The diagram represents one of three independent experiments with similar outcomes.
FIG. 4
FIG. 4
Potentiation of CD95L promoter activity by simultaneously applied anticancer drugs. Hep3B cells were transiently transfected with the −36/+100 CD95L promoter construct. Cells were treated for 48 h with 1.7 μM etoposide (eto) or 100 μg of 5-FU/ml or both agents, as indicated. Cells were lysed, and luciferase activity was measured. Three experiments with similar outcomes were performed. Transfection efficiencies were monitored by cotransfection of a Renilla luciferase construct driven from a basal promoter.
FIG. 5
FIG. 5
A region in the 5′ untranslated region of the CD95L gene comprising nucleotides +20 to +100 is responsible for CD95L induction following treatment with chemotherapeutic drugs. (A) Overview of the 5′ untranslated region of the CD95L gene. Bars represent the −36/+19 and −36/+100 constructs. The circled sequence is the AP-1 site near the first ATG. The arrow indicates the translation start site. (B) Hep3B cells were transfected with the constructs described in A above, and luciferase activity was measured following 48 h of treatment with 5-FU (100 μg/ml). One representative experiment with triplicate samples out of five independent experiments performed is shown. pnull.luc is a promoterless construct used as negative control. Transfection efficiency was controlled by cotransfection of a Renilla luciferase construct. RLU, relative light units.
FIG. 6
FIG. 6
The −36/+100 and −36/+19 constructs show different kinetics of activation and different inducibility upon cotransfection of c-jun and c-fos. (A) Cotransfection experiments in Hep3B cells with expression vectors for c-jun and c-fos. The cotransfected cells were subsequently treated with 100 μg of 5-FU/ml for 48 h or left untreated. Transfection efficiency was normalized by cotransfection of either an expression vector for chloramphenicoltransferase (CAT) or Renilla luciferase, both under the control of a basal promoter. Luciferase activity was measured with the dual luciferase assay from Promega according to the instructions of the manufacturer. CAT protein content was determined by a commercial CAT enzyme-linked immunosorbent assay (Boehringer GmbH, Mannheim, Germany). Mean values with standard deviation from four independent experiments are shown. Fold induction values in A and B were calculated as follows: relative light units (treated cells)/relative light units (untreated cells). (B) Dual luciferase assay with Hep3B cells cotransfected with the described CD95L promoter constructs and a Renilla luciferase expression vector as a control for transfection efficiency. Cells were treated as described above and were harvested after the indicated time points. In addition, the protein content of the transfected cells was measured. Data are the mean with standard deviation of triplicate samples of one representative experiment. Four independent experiments were performed.
FIG. 7
FIG. 7
Mutations in the AP-1 site of the CD95L promoter destroy the inducibility of the promoter constructs, and induction is inhibited by dominant-negative c-Jun. (A) The AP-1 site in the basal promoter was mutated as indicated. To investigate the effect on the basal promoter, Hep3B cells were transfected with the −36/+100 (CD95L wild-type promoter [prom wt]) or the APX4 (mutated −36/+100 CD95L.luc, CD95L mutant promoter [prom mut]) constructs, respectively. To investigate the effect on the full-length promoter, Hep3B cells were transfected with the −1204/+100 (CD95L prom wt) or the APX4/−1204 (mutated −1204/+100 CD95L.luc, CD95L prom mut) constructs, respectively. Transfection efficiency was monitored by cotransfection of Renilla luciferase. Following transfection, cells were treated with 5-FU (100 μg/ml) for 48 h. Luciferase activity was measured and fold induction was calculated. One representative experiment out of five performed is shown. (B) Influence of dominant-negative c-jun (DN c-jun). Hep3B cells were transfected with the −36/+100, −36/+19, or pnull.luc constructs. Cells were either cotransfected with a control plasmid (c) or an expression construct for dominant-negative c-jun (+). As a control, c-jun was also cotransfected in one experiment. After completion of the transfection, cells were split and one-half was treated with 100 μg of 5-FU/ml and the other half was left untreated. Bars show fold induction calculated as follows: relative light units (treated cells)/relative light units (untreated cells). Relative luciferase units were normalized by Renilla luciferase activity using the dual luciferase system. Three independent experiments were performed, and one representative experiment is shown. The asterisks indicate that the absolute luciferase values in this experiment were approximately 75-fold higher than in experiments performed without the cotransfection of c-jun.
FIG. 8
FIG. 8
Nuclear extracts from liver cell lines treated with chemotherapeutic drugs shift an oligonucleotide comprising the AP-1 sequence in the CD95L promoter. Electrophoretic mobility shift assay and supershift analyses of the +73/+99 region of the human CD95 ligand promoter sequence. Nuclear extracts from HepG2 and Hep3B cells were prepared as described in Materials and Methods. Cells had either been treated with 100 μg of 5-FU/ml for 48 h or been left untreated. Electrophoretic mobility shift analyses were done as described previously. For supershift analyses, antibodies against c-Jun or c-Fos were added. AP-1 wt or AP-1 mut are, respectively, the wild-type or mutant +73/+99 promoter regions used for competition experiments. Ø, negative control without nuclear extracts; −, untreated cells; +, treated cells. Antibodies were added as indicated. NS, nonspecific complexes; AP-1, specific complexes. Shift jun and shift fos indicate the respective shifted complexes.
FIG. 9
FIG. 9
c-Jun protein is upregulated in Hep3B cells and primary human hepatocytes following treatment with chemotherapeutic drugs. (A to D) Hep3B cells were seeded on LabTek culture slides and cultured for 2 days. Subsequently, cells were either left untreated (A and B) or treated with 5-FU (100 μg/ml) for 36 h (C and D) and were fixed and stained with an antibody specific to c-Jun, as described above. DAPI (4′,6′-diamidino-2-phenylindole) staining of the same cells as in panels A and C is shown in panels B and D, respectively. (E to H) Human primary hepatocytes were isolated as described in Materials and Methods and seeded on LabTek culture slides. Cells were left untreated (E and F) or treated with 50 μg of 5-FU/ml for 24 h (G and H) and were fixed and stained with an antibody specific to c-Jun. DAPI staining of the same cells as in panels E and G is shown in panels F and H, respectively.
FIG. 10
FIG. 10
The JNK pathway is activated and dominant-negative (DN) MEKK-1 and JNKK-1 constructs inhibit promoter activation upon treatment with chemotherapeutic drugs. (A) C-Jun and JNK are phosphorylated in HepG2 cells upon treatment with 100 μg of 5-FU/ml. At the indicated time points after treatment with 5-FU, cells were harvested and either activity of JNK was measured by an in vitro kinase immunocomplex assay with GST-c-Jun as a substrate (GST-c-Jun-P) or phosphorylation of JNK was determined by Western blotting with antibodies specific for phosphorylated JNK1/2 (anti-P-JNK). (B) Cotransfection experiments with a control vector (pUCSV) or with dominant-negative mutants for the stress-activated protein kinases JNKK-1, MEKK-1, MKK3, and MKK6. Values of fold induction were calculated as described above. One representative experiment out of three independent experiments is shown.

Similar articles

Cited by

References

    1. Angel P, Allegretto E A, Okino S T, Hattori K, Boyle W J, Hunter T, Karin M. Oncogene jun encodes a sequence-specific trans-activator similar to AP-1. Nature. 1988;332:166–171. - PubMed
    1. Angel P, Hattori K, Smeal T, Karin M. The jun proto-oncogene is positively autoregulated by its product, Jun/AP-1. Cell. 1988;55:875–885. - PubMed
    1. Behrens A, Sibilia M, Wagner E F. Amino-terminal phosphorylation of c-Jun regulates stress-induced apoptosis and cellular proliferation. Nat Genet. 1999;21:326–329. - PubMed
    1. Berndt C, Mopps B, Angermuller S, Gierschik P, Krammer P H. CXCR4 and CD4 mediate a rapid CD95-independent cell death in CD4(+) T cells. Proc Natl Acad Sci USA. 1998;95:12556–12561. - PMC - PubMed
    1. Berry M N, Friend D S. High-yield preparation of isolated rat liver parenchymal cells: a biochemical and fine structural study. J Cell Biol. 1969;43:506–520. - PMC - PubMed

MeSH terms