. 2000 Oct;116(4):561-8.
doi: 10.1085/jgp.116.4.561.

Pore block versus intrinsic gating in the mechanism of inward rectification in strongly rectifying IRK1 channels

Affiliations

Pore block versus intrinsic gating in the mechanism of inward rectification in strongly rectifying IRK1 channels

D Guo et al. J Gen Physiol. 2000 Oct.

Abstract

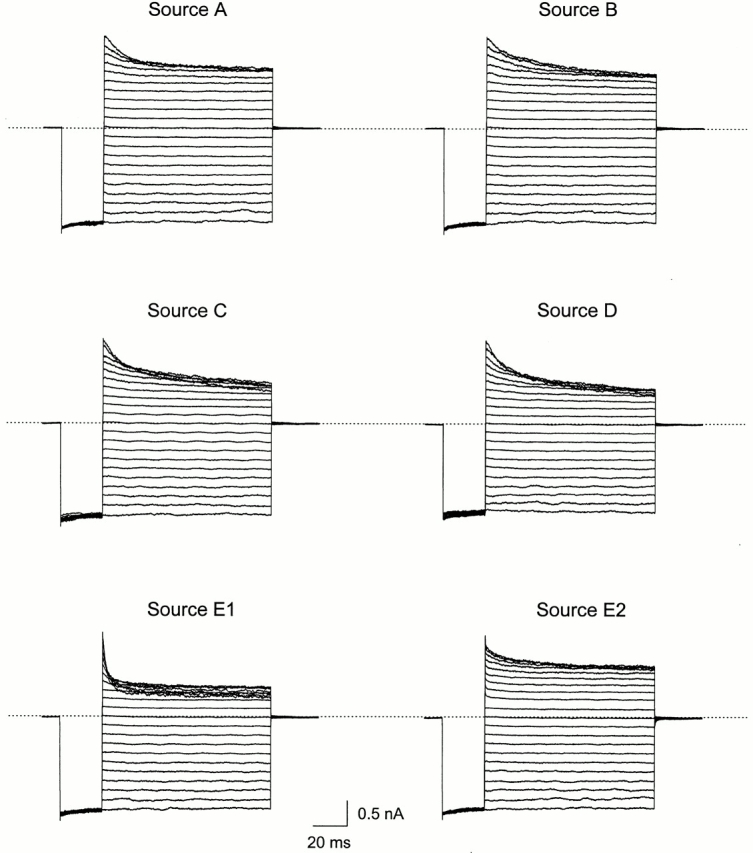
The IRK1 channel is inhibited by intracellular cations such as Mg(2+) and polyamines in a voltage-dependent manner, which renders its I-V curve strongly inwardly rectifying. However, even in excised patches exhaustively perfused with a commonly used artificial intracellular solution nominally free of Mg(2+) and polyamines, the macroscopic I-V curve of the channels displays modest rectification. This observation forms the basis of a hypothesis, alternative to the pore-blocking hypothesis, that inward rectification reflects the enhancement of intrinsic channel gating by intracellular cations. We find, however, that residual rectification is caused primarily by the commonly used pH buffer HEPES and/or some accompanying impurity. Therefore, inward rectification in the strong rectifier IRK1, as in the weak rectifier ROMK1, can be accounted for by voltage-dependent block of its ion conduction pore by intracellular cations.


Figures

Figure 1
Figure 1
Current–voltage relationship of the IRK1 channel in the presence of various pH buffers. (A and B) Current traces recorded from inside-out patches at membrane voltages between −100 and +100 mV in 10-mV increments, corrected for the background currents shown in C and D, respectively. Both intracellular and extracellular solutions contain either HEPES (A) or phosphate (B). The dashed lines identify the zero-current levels. (E) Normalized steady state I-V curves with intracellular solutions containing (mM): 10 phosphate and 5 EDTA (□), 10 borate and 5 EDTA (○), 10 phosphate and 1 EDTA (⋄), 10 MOPS and 5 EDTA (▵), and 10 HEPES and 5 EDTA (▿). In each case, the extracellular pH buffer was the same as in the intracellular solution.
Figure 2
Figure 2
Current–voltage relationship of the D172N mutant IRK1 channel in the presence of various pH buffers. (A and B) Current traces of the D172N channels recorded from inside-out patches with voltage protocol as in Fig. 1. Both intracellular and extracellular solutions contained either HEPES (A) or phosphate (B). (C) Normalized steady state I-V curves with intracellular solutions buffered by: phosphate (□), borate (○), MOPS (▵), and HEPES (▿). In each case, the extracellular pH buffer was the same as in the intracellular solution.
Figure 5
Figure 5
IRK1 current in the presence of 10 mM HEPES from different sources in the intracellular solution. All current traces were obtained from the same patch. The voltage protocol was as in Fig. 1. The extracellular solution contained 10 mM phosphate but no HEPES.
Figure 3
Figure 3
IRK1 current in the presence of various concentrations of intracellular HEPES in addition to 10 mM phosphate. The voltage protocol was as in Fig. 1; all records were from the same patch. The extracellular solution contained 10 mM phosphate but no HEPES.
Figure 4
Figure 4
Current–voltage relationship of the IRK1 channel in the presence of various concentrations of intracellular HEPES. (A) Steady state I-V curves with various concentrations of intracellular HEPES, obtained from the data shown in Fig. 3. (B) Ratios of the I-V curves with and without HEPES shown in A. The curves superimposed on the data are fits of the equation I/I o = K d/(K d + [HEPES]), where K d = K d(0 mV) e ZF Vm/ RT. The fits yield K d(0 mV) = 0.96 ± 0.04 M and Z = 1.0 ± 0.1 (mean ± SEM; n = 4).
Figure 6
Figure 6
Current–voltage relation of the IRK1 channel in the presence of 10 mM HEPES from different sources. (A) The linear steady state I-V curve was obtained in the presence of 10 mM intracellular phosphate without HEPES; the others were obtained in the presence of HEPES from the various sources used for the data shown in Fig. 5. All seven I-V curves were obtained from the same patch as in Fig. 5. (B) Ratios of the I-V curves with and without HEPES shown in A. The curves superimposed on the data are fits of the equation in Fig. 4. The fitted K d values (M) are: 1.11 ± 0.06, 0.89 ± 0.10, 0.36 ± 0.04, 0.39 ± 0.02, 0.34 ± 0.02, and 0.65 ± 0.07 (mean ± SEM; n = 4) for sources A, B, C, D, E1, and E2, respectively. The fitted Z values are: 1.02 ± 0.01, 0.97 ± 0.01, 0.97 ± 0.01, 1.00 ± 0.01, 0.98 ± 0.01, and 0.97 ± 0.01 for 0.07 (mean ± SEM; n = 4) for sources A, B, C, D, E1, and E2, respectively.
Figure 7
Figure 7
Current–voltage relation of the IRK1 channel in the presence of intracellular di- and polyamines. (A–C) Steady state I-V curves in the absence or presence of various concentrations of intracellular putrescine, spermidine, or spermine. (D–F) Ratios of the I-V curves with and without putrescine, spermidine, or spermine shown in A–C. The concentrations of the blockers were as indicated. The curves superimposed on the data in D or in E and F are fits of Eqs. 2 and 6, respectively, of Guo and Lu 2000a. Parameter values obtained from the fits are as follows (mean ± SEM; n = 3). For putrescine, K 1 = 8.2 (± 0.9) × 10−4 M, Z1 = 1.9 ± 0.2; k −2/k −1 = 4.0 (± 0.5) × 10−2, “z −1 + z −2” = 1.6 ± 0.1. For spermidine, K a 1 = 3.9 (± 0.5) × 10−6 M, Za 1 = 5.4 ± 0.4; k a −2/k a −1 = 2.7 (± 0.4) × 10−2, “z a −1 + z a −2” = 5.6 ± 0.4; K b 1 = 4.5 (± 0.6) × 10−5 M, Zb 1 = 3.3 ± 0.4; k b −2/k b −1 = 2.0 (± 0.2) × 10−3, “z b −1 + z b −2” = 3.4 ± 0.5. For spermine, K a 1 = 2.4 (± 0.3) × 10−7 M, Za 1 = 5.5 ± 0.4; k a −2/k a −1 = 3.5 (± 0.4) × 10−2, “z a −1 + z a −2” = 5.7 ± 0.5; K b 1 = 6.8 (± 0.7) × 10−6 M, Zb 1 = 3.6 ± 0.3; k b −2/k b −1 = 6.9 (± 0.8) × 10−4, “z b −1 + z b −2” = 3.5 ± 0.4.

References

    1. Aleksandrov A., Velimirovic B., Clapham D.E. Inward rectification of the IRK1 K+ channel reconstituted in lipid bilayers. Biophys. J. 1996;70:2680–2687. - PMC - PubMed
    1. Armstrong C.M., Binstock L. Anomalous rectification in the squid giant axon injected with tetraethylammonium. J. Gen. Physiol. 1965;48:859–872. - PMC - PubMed
    1. Fakler B., Brandle U., Glowatzki E., Weidemann S., Zenner H.P., Ruppersburg J.P. Strong voltage-dependent inward-rectification of inward-rectifier K+ channels is caused by intracellular spermine. Cell. 1995;80:149–154. - PubMed
    1. Ficker E., Taglialatela M., Wible B.A., Henley C.M., Brown A.M. Spermine and spermidine as gating molecules for inward rectifier K+ channels. Science. 1994;266:1068–1072. - PubMed
    1. Guo D., Lu Z. Mechanism of IRK1 channel block by intracellular polyamines J. Gen. Physiol. 115 2000. 799 813a - PMC - PubMed

Publication types