. 2000 Sep 26;97(20):10751-6.
doi: 10.1073/pnas.97.20.10751.

Identification of a third distinct estrogen receptor and reclassification of estrogen receptors in teleosts

Affiliations

Identification of a third distinct estrogen receptor and reclassification of estrogen receptors in teleosts

M B Hawkins et al. Proc Natl Acad Sci U S A. .

Abstract

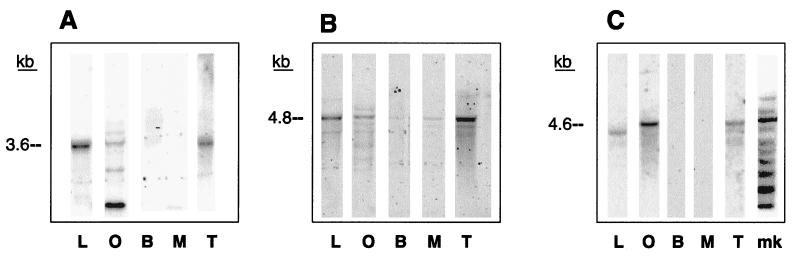
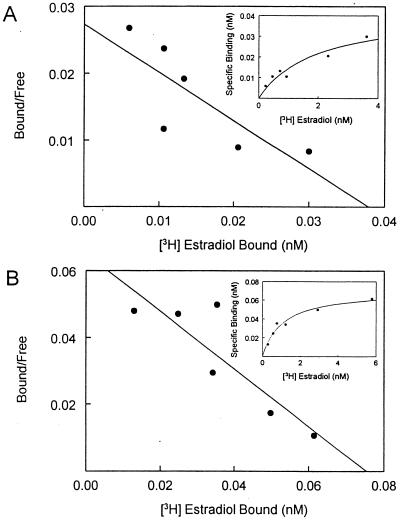
This paper describes three distinct estrogen receptor (ER) subtypes: ERalpha, ERbeta, and a unique type, ERgamma, cloned from a teleost fish, the Atlantic croaker Micropogonias undulatus; the first identification of a third type of classical ER in vertebrate species. Phylogenetic analysis shows that ERgamma arose through gene duplication from ERbeta early in the teleost lineage and indicates that ERgamma is present in other teleosts, although it has not been recognized as such. The Atlantic croaker ERgamma shows amino acid differences in regions important for ligand binding and receptor activation that are conserved in all other ERgammas. The three ER subtypes are genetically distinct and have different distribution patterns in Atlantic croaker tissues. In addition, ERbeta and ERgamma fusion proteins can each bind estradiol-17beta with high affinity. The presence of three functional ERs in one species expands the role of ER multiplicity in estrogen signaling systems and provides a unique opportunity to investigate the dynamics and mechanisms of ER evolution.


Figures

Figure 1
Figure 1
The deduced amino acid sequences of the three croaker cDNAs [Atlantic croaker ER α (acERα), Atlantic croaker ER β (acERβ), Atlantic croaker ER γ (acERγ)] indicating diagnostic features of ER genes. Croaker sequences were aligned with 33 other ERs by using clustalx (16). Amino acids that diagnose the clade of ERγs (those that changed on the branch leading to this group of receptors on the phylogeny in Fig. 2 and thereafter were conserved in all known members) are red. The DBD is underlined and the LBD is bracketed. The transactivation function region, TAF-2, which is involved in ligand-dependent transactivation, is underlined (22). Amino acids at the receptor dimerization interface are noted with (formula image
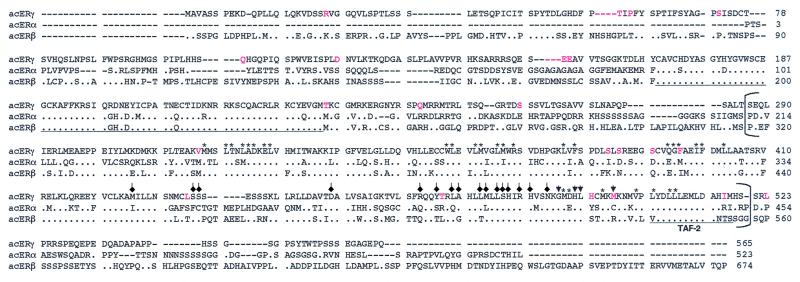
) (23). Positions that contact ligands in mammalian ERs are noted with an asterisk (24, 25). The amino acids in the LBD known to be critical for E2 binding are noted with arrows (26). Sequence notation includes alignment gaps (–) and identity with croaker ER gamma (.).
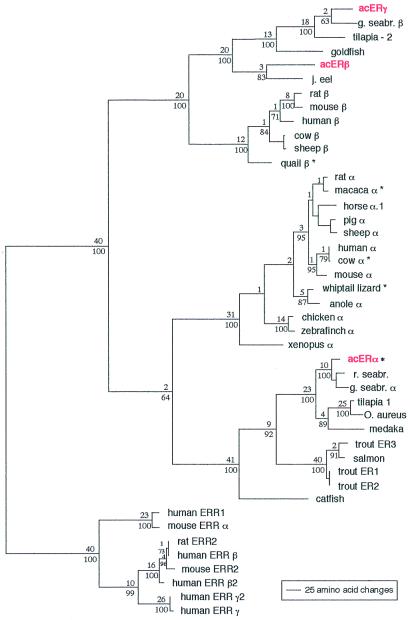
Figure 2
Figure 2
Phylogenetic analysis of ER sequences including Atlantic croaker (ac) ER cDNAs acERα, acERβ, and acERγ. This tree shows three clades of paralogous ERs, demonstrating the existence of three distinct ER types: ERα, ERβ, and ERγ. ERαs and ERβs are present in both teleosts and tetrapods, whereas ERγs are present only in teleosts and are closely related to ERβs. Each clade is well supported, as shown by high bootstrap values (below each branch) and Bremer supports (above each branch), which express the degree of character support for each clade as the number of extra amino acid changes in the most parsimonious tree that does not contain the clade as compared with the most parsimonious tree that does (27). The tree was rooted by using the estrogen-related receptors (ERR) as the outgroup. Branch lengths are proportional to the number of amino acid changes on the branch. Partial sequences (*) may have artificially short branches. Tree length, 3,090 amino acid changes; consistency index, 0.7714; retention index, 0.8797. GenBank accession nos.: anolis ER, AAC64412.1; catfish ER, AAC69548.1; chicken ER, 625329; cow ERα, P49884; cow ERβ, AAD24432.1; acERα, AF298183; acERβ, AF298181; acERγ, AF298182; gilthead seabream (g. seabr.) ERβ, AAD31033.1; g. seabr. ERα, AF136979_1; goldfish ER, AF061269_1; human ERR γ, NP001429.1; horse ERα.1, AAD17316.1; human ERα, P03372; human ERR1, P11474; human ERβ, BAA24953.1; human ERR β, NP 004443.1; human ERR β2, AAC99409.1; human ERR γ2, AAC99410.1; Japanese eel ER, BAA19851.1; macaca ERα, P49886; medaka ER, P50241; mouse ERR2, S58087; mouse ERα, P19785; mouse ERβ, AAB51132.1; mouse ERR α, AAB51250.1; Oreochromis aureus ER, P50240; pig ERα, Q29040; quail ERβ, AAC36463.2; rat ERα, CAA43411.1; rat ERβ, AAC52602.1; red seabream (r. seabr.) ER, O42132; salmon ER, P50242; sheep ERβ, AAD10826.1; sheep ERα, Z49257.1; tilapia ER2, AAD00246.1; tilapia ER1, AAD00245.1; trout ER1, CAB45139.1; trout ER2, CAB45140.1; trout ER3, P16058; whiptail lizard ERα, AAB35739.1; Xenopus ERα, 625330; and zebrafinch ERα, AAB81108.1.
Figure 3
Figure 3
Northern blot analysis of ER mRNAs in tissues of mature female (n = 3 for α and γ; n = 2 for β) and mature male (n = 2, testes only) Atlantic croaker. L, liver; O, ovary; B, brain; M, muscle; T, testes. Amounts of mRNA loaded per tissue type: liver, ovary, testes = 3 μg per lane; brain = 2 μg per lane; muscle = 1.3 μg per lane. Lanes shown are one of three loads of mRNA from the same fish. (A) Atlantic croaker ERα (acERα). (B) Atlantic croaker ERβ (acERβ). (C) Atlantic croaker ERγ (acERγ). The size (kb) of each transcript is indicated. RNA size markers (mk) are shown (Millennium Markers, Ambion).
Figure 4
Figure 4
Photomicrographs showing differential ER subtype mRNA distribution in the female Atlantic croaker hypothalamus through in situ hybridization. Sections shown are adjacent transverse cryosections hybridized with a [35S]CTP-labeled antisense riboprobe complementary to each ER mRNA. Specific binding to mRNA by the riboprobes is seen in the dark-field images (B, C, and D) as bright white dots (silver grains) clustered over cells, and in the bright-field image (A) as small black dots. (A) The corresponding bright-field image of the section shown in D. (B) acERα mRNA distribution throughout the preoptic nucleus. (C) acERβ mRNA localization along the third ventricle wall (3V). (D) acERγ mRNA distribution lateral to the third ventricle in the suprachiasmatic nucleus (Sn).
Figure 5
Figure 5
Scatchard plots of acERβ (A) and acERγ (B) translation products showing saturable binding to radiolabeled E2. Specific binding (Inset) was calculated as the difference between total and nonspecific binding. Unprogrammed reticulocyte lysate exhibited no specific binding (data not shown).

References

    1. Kuiper G G J M, Enmark E, Pelto-Huikko M, Nilsson S, Gustafsson J-Å. Proc Natl Acad Sci USA. 1996;93:1–5. - PMC - PubMed
    1. Kuiper G G J M, Carlsson B, Grandien K, Enmark E, Hagglad J, Nilsson S, Gustafsson J-Å. Endocrinology. 1997;138:863–870. - PubMed
    1. Paech K, Webb P, Kuiper G G J M, Nilsson S, Gustafsson J-Å, Kushner P J, Scanlan T S. Science. 1997;277:1508–1510. - PubMed
    1. Todo T, Adachi S, Yamauchi K. Mol Cell Endocrinol. 1996;119:37–45. - PubMed
    1. Mosselman S, Polman J, Dijkema R. FEBS Lett. 1996;392:49–53. - PubMed

Publication types

Associated data

LinkOut - more resources