. 2000 Sep 26;97(20):10814-9.
doi: 10.1073/pnas.97.20.10814.

Tid1/Rdh54 promotes colocalization of rad51 and dmc1 during meiotic recombination

Affiliations

Tid1/Rdh54 promotes colocalization of rad51 and dmc1 during meiotic recombination

M Shinohara et al. Proc Natl Acad Sci U S A. .

Abstract

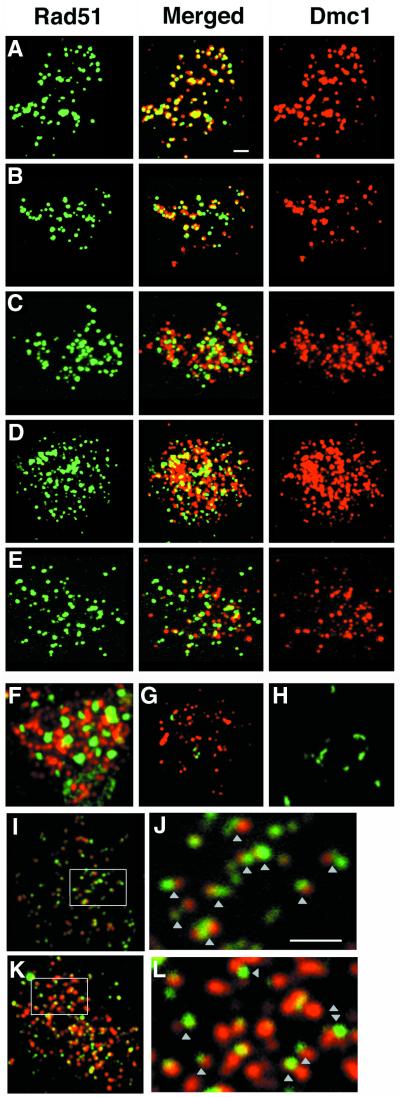
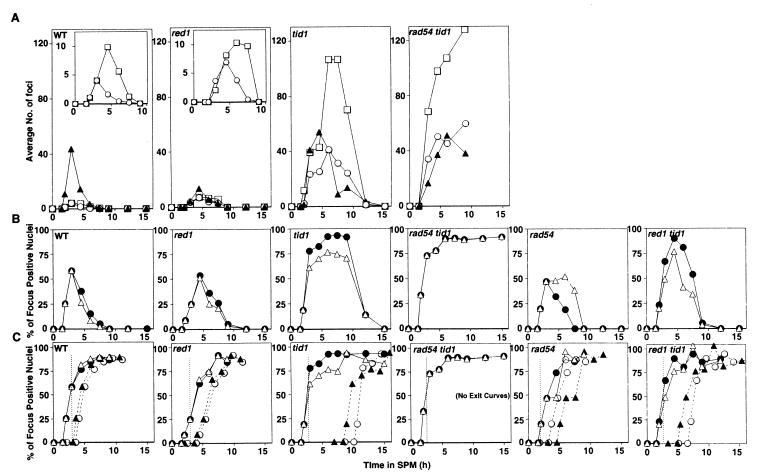
Two RecA homologs, Rad51 and Dmc1, assemble as cytologically visible complexes (foci) at the same sites on meiotic chromosomes. Time course analysis confirms that co-foci appear and disappear as the single predominant form. A large fraction of co-foci are eliminated in a red1 mutant, which is expected as a characteristic of the interhomolog-specific recombination pathway. Previous studies suggested that normal Dmc1 loading depends on Rad51. We show here that a mutation in TID1/RDH54, encoding a RAD54 homolog, reduces Rad51-Dmc1 colocalization relative to WT. A rad54 mutation, in contrast, has relatively little effect on RecA homolog foci except when strains also contain a tid1/rdh54 mutation. The role of Tid1/Rdh54 in coordinating RecA homolog assembly may be very direct, because Tid1/Rdh54 is known to physically bind both Dmc1 and Rad51. Also, Dmc1 foci appear early in a tid1/rdh54 mutant. Thus, Tid1 may normally act with Rad51 to promote ordered RecA homolog assembly by blocking Dmc1 until Rad51 is present. Finally, whereas double-staining foci predominate in WT nuclei, a subset of nuclei with expanded chromatin exhibit individual Rad51 and Dmc1 foci side-by-side, suggesting that a Rad51 homo-oligomer and a Dmc1 homo-oligomer assemble next to one another at the site of a single double-strand break (DSB) recombination intermediate.


Figures

Figure 1
Figure 1
Colocalization of Rad51 and Dmc1 foci. Spreads of meiotic nuclei were prepared and indirectly immunostained with antibodies against Rad51 (green; Left) and Dmc1 (red; Right). Single-staining images are pseudocolored from the gray scale images. Merged images are a two-channel combination of original image pairs (Middle). Representative nuclei are shown. (A) WT, 3 h; (B) red1, 3 h; (C) tid1, 3 h; (D) rad54 tid1, 3 h; (E) red1 tid1, 3 h; (F) rad54 tid1, 12-h nucleus showing Rad51 aggregates; (G) WT, 4.5-h nucleus with mostly D foci; (H) rad54, 4.5-h nucleus with mostly R foci; (I and J) WT, 4.5-h nucleus showing side-by-side R and D foci; (K and L) rad54 tid1, 7.5-h nucleus showing side-by-side R and D foci. J and L are photographic enlargements of the areas indicated in I and K, respectively. (White scale bars = 2 μm long.)
Figure 2
Figure 2
(A) Time course analysis of Rad51 and Dmc1 foci. One hundred nuclei were randomly selected. The number of foci in each of the three possible focus classes, RD foci (closed triangles); R foci (open circles), and D foci (open squares), were counted in each nucleus examined. The average numbers of the foci at each time point are shown. (B and C) Time course analysis of Rad51 and Dmc1 focus-positive nuclei. The percentages of nuclei containing more than five foci were derived from the images of more than 100 random nuclei from each time point. The threshold of five is set to avoid including nuclei that display a small amount of background staining in the focus-positive class (ref. ; and M.S., unpublished data). Noncumulative curves (B) are converted into cumulative curves (C) by using the method of Padmore et al. (44). The duration of a stage is given by the area under the corresponding noncumulative curve, divided by the total fraction of nuclei progressing through meiosis (44), assumed to be 90% at all time points. The average life span of Rad51-positive nuclei was 1.77 ± 0.24 h (n = 7). Cumulative curves describe what fraction of cells have either entered or completed a given event as a function of time. The curve is identical to the noncumulative curve plotted up to the first nonzero time point and one life span thereafter. Then, for any time point (t) after one life span has elapsed, the cumulative curve value at t is equal to the noncumulative curve value at t plus the cumulative curve value at t minus one life span. The exit curve for any event is given by plotting entry curve at a rightward displacement along the x axis by one life span. From the left: WT, red1, tid1, rad54 tid1, rad54, and red1 tid1 mutants. In B, percentages of R+ and D+ nuclei are indicated by open triangles and closed circles, respectively. In C, the fraction of nuclei that had entered R+ and D+ stages are indicated by open triangles and closed circles, respectively. The fraction that had exited R+ and D+ stages are indicated as hatched lines with closed triangles and open circles, respectively. The vertical line in each panel highlights the 3-h time point. Construction of cumulative curves assumes that the life span of a particular stage is constant as time progresses. The bi-phasic shape of the R+ curve in the tid1 mutant suggests that the life span of this stage is not uniform in this mutant.

References

    1. Lichten M, Goldman A S. Annu Rev Genet. 1995;29:423–444. - PubMed
    1. Schwacha A, Kleckner N. Cell. 1995;83:783–791. - PubMed
    1. Kleckner N. Proc Natl Acad Sci USA. 1996;93:8167–8174. - PMC - PubMed
    1. Roeder G S. Genes Dev. 1997;11:2600–2621. - PubMed
    1. Szostak J W, Orr-Weaver T L, Rothstein R J, Stahl F W. Cell. 1983;33:25–35. - PubMed

Publication types