. 2000 Sep 26;97(20):10850-4.
doi: 10.1073/pnas.97.20.10850.

Predicting species diversity in tropical forests

Affiliations

Predicting species diversity in tropical forests

J B Plotkin et al. Proc Natl Acad Sci U S A. .

Abstract

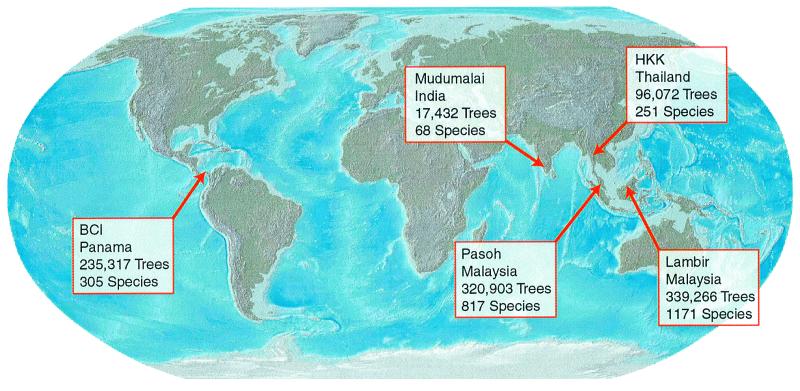
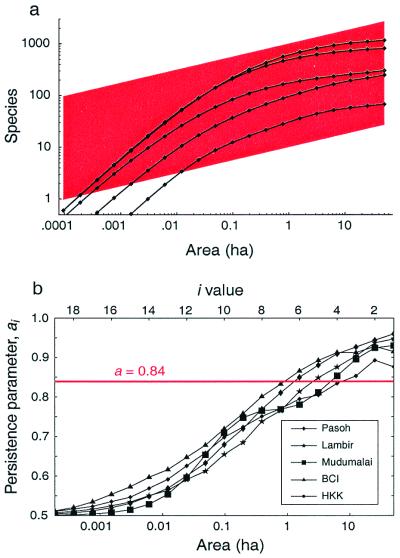
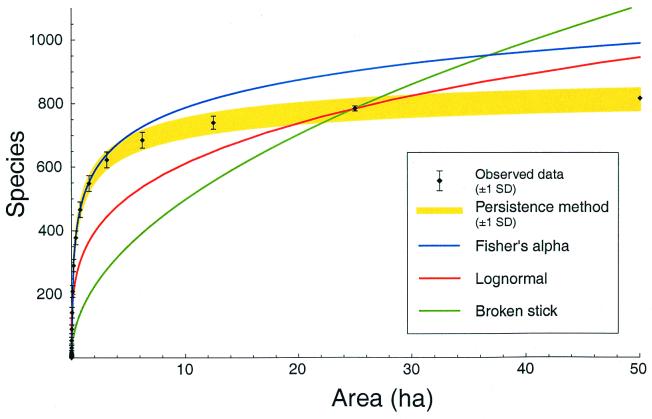
A fundamental question in ecology is how many species occur within a given area. Despite the complexity and diversity of different ecosystems, there exists a surprisingly simple, approximate answer: the number of species is proportional to the size of the area raised to some exponent. The exponent often turns out to be roughly 1/4. This power law can be derived from assumptions about the relative abundances of species or from notions of self-similarity. Here we analyze the largest existing data set of location-mapped species: over one million, individually identified trees from five tropical forests on three continents. Although the power law is a reasonable, zeroth-order approximation of our data, we find consistent deviations from it on all spatial scales. Furthermore, tropical forests are not self-similar at areas </=50 hectares. We develop an extended model of the species-area relationship, which enables us to predict large-scale species diversity from small-scale data samples more accurately than any other available method.


Figures

Figure 1
Figure 1
The locations of five tropical forest plots across the globe. Each census encompasses 50 ha of forest within which every woody stem greater than 1 cm in diameter has been identified to species, measured for girth, and spatially mapped to <1-m accuracy. The name, country, number of trees, and number of species is indicated for each plot. The forests vary widely in species diversity and environment. Pasoh and Lambir (Malaysia) are evergreen, dipterocarp rainforests; BCI (Panama) is a lowland, moist forest, with a 4-month dry season; HKK (Thailand) and Mudumalai (India) are the only forests that are regularly subject to fires. For a complete list of references, consult the Center for Tropical Forest Science web site at http://www.stri.org.
Figure 2
Figure 2
Graphs of the SAR and the spatial persistence parameter for each of five tropical forests. (a) Log-log graph of the observed species-area data. Each plot encompasses a total area A0 = 50 ha. We measure the mean species diversity, Si, found in disjoint patches obtained by repeated bisections of A0. The log-log species-area data are concave down for all five plots. The SAR is approximated loosely by the power law, z = 0.25, whose slope is indicated by the trapezoid (red). (b) The persistence parameter, ai = Si/Si−1, provides a sensitive tool for analyzing SARs and testing self-similarity. Self-similarity would predict constant a ≃ 2−0.25 ≃ 0.84, shown in red. All five persistence curves are seen to depart from the power-law model over the entire range of areas.
Figure 3
Figure 3
The actual SAR at Pasoh (black) compared with the SAR predicted by our model and three classical models. Assuming that individuals scale linearly with area, MacArthur's “broken stick” distribution of relative abundances, the canonical lognormal distribution, and Fisher's log series each yields a one-parameter model of the SAR (green, red, and blue, respectively). The first two of these models were parameterized by using 25 ha of Pasoh data; 1 ha was used to parameterize the log series. The log series provides a fairly accurate model, but it overestimates 50-ha diversity by 21%. The canonical log normal accounts for steeper slopes at small areas and gentler slopes at large areas, and hence it is more accurate than the broken stick (17). Our persistence method (yellow) requires two parameters, fit by using any other forest, and an initial condition obtained from 1 ha of Pasoh data. The persistence method extrapolates 50-ha diversity with 3% average error. The figure indicates a 1-SD confidence interval around the extrapolation.

References

    1. May R. Philos Trans R Soc London B. 1999;354:1951–1959. - PMC - PubMed
    1. Reid W, Miller K. Keeping Options Alive: The Scientific Basis for Conservation Biology. Washington, DC: World Resources Institute; 1989.
    1. Reid W. In: Tropical Deforestation and Species Extinction. Whitmore T, Sayer J, editors. London: Chapman & Hall; 1992. pp. 55–73.
    1. Simberloff D. In: Dynamics of Extinction. Elliot D, editor. New York: Wiley; 1986. pp. 165–180.
    1. Raven P. In: Biodiversity. Wilson E O, Peter F, editors. Washington, DC: Natl. Acad. Press; 1988. pp. 119–122.

LinkOut - more resources