. 2000 Sep 26;97(20):11026-31.
doi: 10.1073/pnas.97.20.11026.

An approach to probe some neural systems interaction by functional MRI at neural time scale down to milliseconds

Affiliations

An approach to probe some neural systems interaction by functional MRI at neural time scale down to milliseconds

S Ogawa et al. Proc Natl Acad Sci U S A. .

Abstract

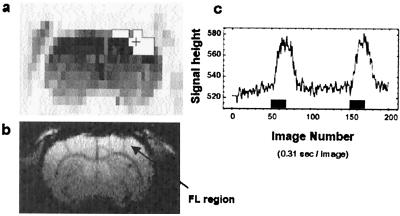
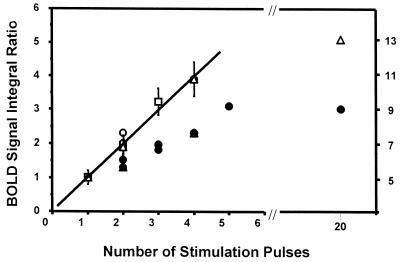
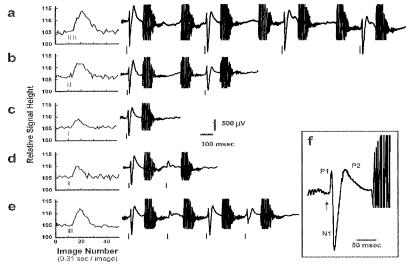
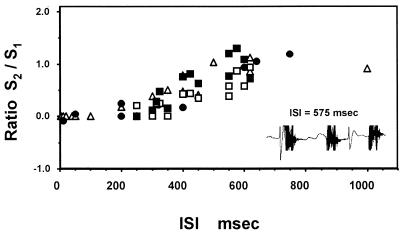
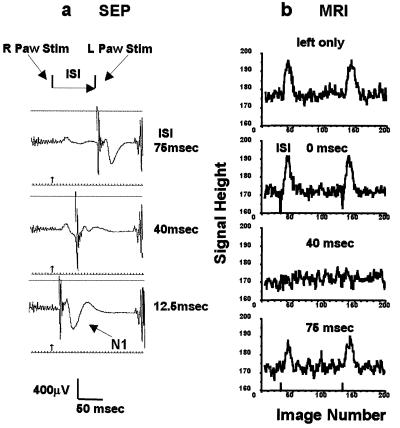
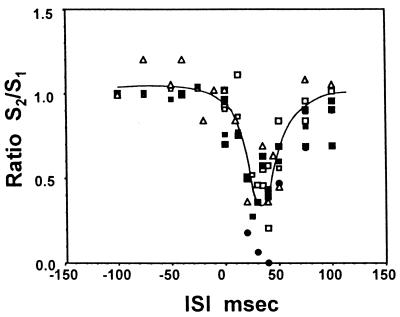
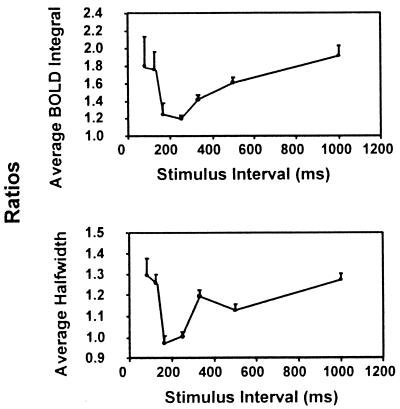
In this paper, we demonstrate an approach by which some evoked neuronal events can be probed by functional MRI (fMRI) signal with temporal resolution at the time scale of tens of milliseconds. The approach is based on the close relationship between neuronal electrical events and fMRI signal that is experimentally demonstrated in concurrent fMRI and electroencephalographic (EEG) studies conducted in a rat model with forepaw electrical stimulation. We observed a refractory period of neuronal origin in a two-stimuli paradigm: the first stimulation pulse suppressed the evoked activity in both EEG and fMRI signal responding to the subsequent stimulus for a period of several hundred milliseconds. When there was an apparent site-site interaction detected in the evoked EEG signal induced by two stimuli that were primarily targeted to activate two different sites in the brain, fMRI also displayed signal amplitude modulation because of the interactive event. With visual stimulation using two short pulses in the human brain, a similar refractory phenomenon was observed in activated fMRI signals in the primary visual cortex. In addition, for interstimulus intervals shorter than the known latency time of the evoked potential induced by the first stimulus ( approximately 100 ms) in the primary visual cortex of the human brain, the suppression was not present. Thus, by controlling the temporal relation of input tasks, it is possible to study temporal evolution of certain neural events at the time scale of their evoked electrical activity by noninvasive fMRI methodology.


Figures

Figure 1
Figure 1
Somatosensory activation by left forepaw stimulation. (a) An activation map (framed white areas) obtained by scout imaging with 20 stimulation pulses (1 mA current and 300 μsec width) at 310 msec interstimulus interval (t test with P = 0.99). (b) An anatomical image (256 × 64) indicating the FL (forelimb) area in the somatosensory cortex at the slice position 1 mm anterior to the bregma. (c) The time course of the T2* weighted response at one pixel (+ mark in the map shown in a, ≈3.7 mm lateral from the midline) with two events of 20 stimulation pulses 30 sec apart. The BOLD signal was an average of five runs.
Figure 2
Figure 2
BOLD responses to a number of stimulation pulses (Paradigm I) given to the rat forepaw. BOLD signal integrals (height times width at half height) relative to the signal by single stimulus (300-μsec-wide current pulse at 0.4 to 0.8 mA) are plotted as a function of the number of stimuli administered. The open symbols are those measured with 620 msec ISI. The error bars indicate the possible ranges of the uncertainty in estimating the normalized values of BOLD signal changes (four rats). The filled symbols are those with 310 msec ISI (two rats).
Figure 3
Figure 3
Simultaneous measurements of SEP and BOLD signals evoked by small number of stimulation pulses (Paradigm I) BOLD signals are averages of four runs and also of two trials in a run, total eight trials. SEP signals are averages time locked to the first stimulus in each trial during MRI measurements. The large noises in the SEP traces are due to the switching field gradient for EPI acquisition repeated at every 310 msec. (a) Four stimuli at ISI 620 msec. (b) Two stimuli at ISI 620 msec. (c) One stimulus. (d) Two stimuli at ISI 313 msec. (e) Four stimuli at ISI 313 msec. (f) SEP pattern responding to the first stimulus. The latencies of the SEP peaks are 16 msec for P1 and 25 msec for N1. Small vertical bars in BOLD and SEP signal traces indicate the onset of stimulation pulses.
Figure 4
Figure 4
Neural refractory process with two stimuli at the same site of activation (Paradigm II). Plotted with ISI are the suppressed responses of BOLD signal (filled symbols) and SEP (open symbols) both to the second stimulus and normalized to the first stimulus response (for BOLD signals see text). The symbols (Δ) are for SEP without MRI; the filled circle symbols are for BOLD signal without EEG electrodes.
Figure 5
Figure 5
Bilateral forepaw stimulation with time delay (Paradigm III). (a) SEP responses at the contralateral somatosensory area to the left forepaw. (Top) ISI 75 msec. (Middle) 40 msec. (Bottom) 12.5 msec. The noises at far right were EPI generated. The sharp spikes at the second stimulation were electrical artifacts. (b) The time courses of BOLD responses (without EEG electrodes) with varied ISI. The pair of stimulations was repeated four times at every 620 msec. Left paw stimulation only, from the top: ISI 0 msec, ISI 40 msec, and ISI 75 msec. The sharp spikes at the onset of stimulation with ISI = 0 msec were due to a small and transient head motion.
Figure 6
Figure 6
The time window of suppression of SEP and BOLD responses with the two-forepaw stimulation paradigm as Fig. 5 (Paradigm III). The symbols (Δ) are those of SEP measurements only, and filled circle symbols are those of MRI measurements without EEG electrodes. Open square symbols are SEP, and filled square symbols are BOLD responses in simultaneous measurements. All responses were normalized to the respective values at ISI of −100 msec (left stimulation first), or the values with left simulation only. The curve was drawn to represent the SEP responses.
Figure 7
Figure 7
Refractory and nonrefractory BOLD responses in the primary visual area of the human brain to two consecutive short stimulus pulses (10 msec wide each) (Top) The variation of the peak integral intensity (height times width) with the interstimulus interval. (Bottom) The peak width variation in the averaged BOLD signal in V1 area. These ratios (normalized to the single stimulus response) are averages among eight subjects, and error bars indicate the SD.

References

    1. Ogawa S, Lee T M, Kay A R, Tank D W. Proc Natl Acad Sci USA. 1990;87:9868–9872. - PMC - PubMed
    1. Kim S-G. Magn Reson Med. 1995;34:293–301. - PubMed
    1. Raichle M E. Handbook of Physiology: The Nervous System. Bethesda: American Physiological Society; 1987. pp. 643–674.
    1. Kwong K K, Belliveau J W, Chesler D A, Goldberg I E, Weisskoff R M, Poncelet B P, Kennedy D N, Hoppel B E, Cohen M S, Turner R. Proc Natl Acad Sci USA. 1992;89:5675–5679. - PMC - PubMed
    1. Zhu X-H, Kim S-G, Andersen P, Ogawa S, Ugurbil K, Chen W. Magn Reson Med. 1998;40:703–711. - PubMed

Publication types