. 2000 Sep 26;97(20):11080-5.
doi: 10.1073/pnas.97.20.11080.

High phosphorylation efficiency and depression of uncoupled respiration in mitochondria under hypoxia

Affiliations

High phosphorylation efficiency and depression of uncoupled respiration in mitochondria under hypoxia

E Gnaiger et al. Proc Natl Acad Sci U S A. .

Abstract

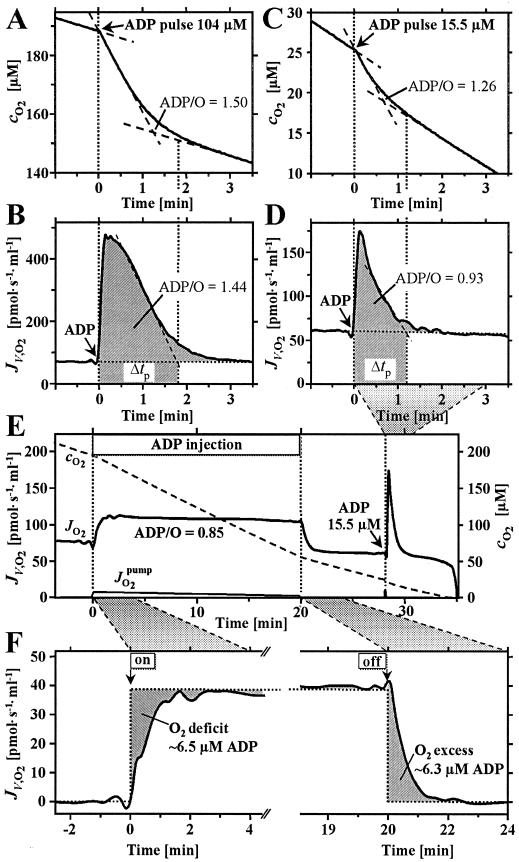
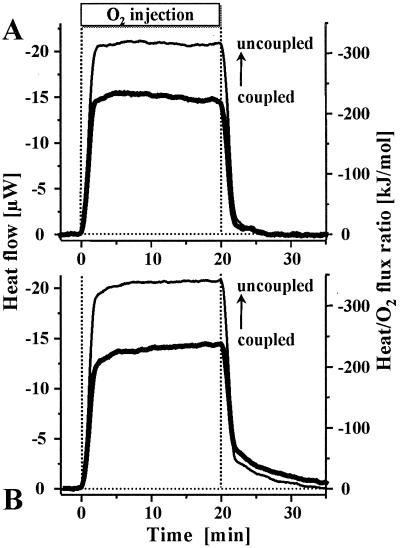
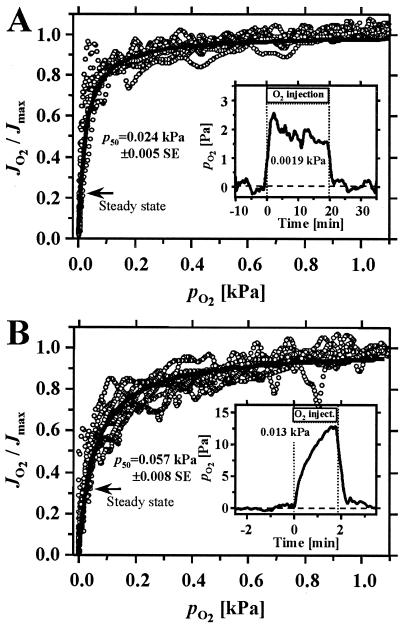
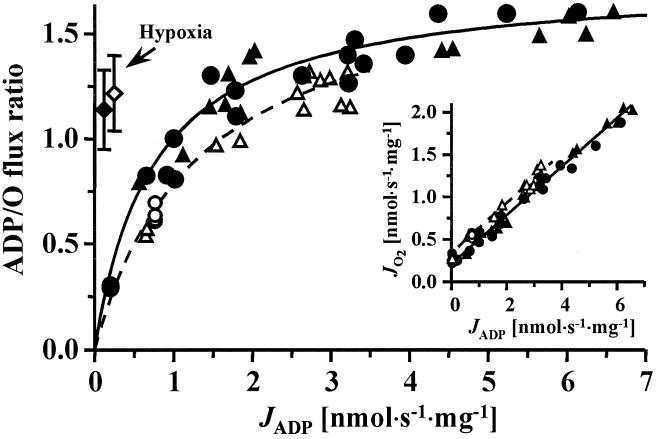
Mitochondria are confronted with low oxygen levels in the microenvironment within tissues; yet, isolated mitochondria are routinely studied under air-saturated conditions that are effectively hyperoxic, increase oxidative stress, and may impair mitochondrial function. Under hypoxia, on the other hand, respiration and ATP supply are restricted. Under these conditions of oxygen limitation, any compromise in the coupling of oxidative phosphorylation to oxygen consumption could accentuate ATP depletion, leading to metabolic failure. To address this issue, we have developed the approach of oxygen-injection microcalorimetry and ADP-injection respirometry for evaluating mitochondrial function at limiting oxygen supply. Whereas phosphorylation efficiency drops during ADP limitation at high oxygen levels, we show here that oxidative phosphorylation is more efficient at low oxygen than at air saturation, as indicated by higher ratios of ADP flux to total oxygen flux at identical submaximal rates of ATP synthesis. At low oxygen, the proton leak and uncoupled respiration are depressed, thus reducing maintenance energy expenditure. This indicates the importance of low intracellular oxygen levels in avoiding oxidative stress and protecting bioenergetic efficiency.


Figures

Figure 1
Figure 1
High-resolution respirometry for determination of ADP/O flux ratios at various levels of ADP stimulation (rat liver mitochondria, 0.21 mg protein/ml). In the conventional analysis of oxygen concentration, cO2 (A; solid line), linear extrapolations (dashed lines) are made during respiration at state 3 after ADP titration, and at state 4 after ADP depletion. The difference of oxygen concentrations at the intercepts is the total oxygen uptake (–31). Lower ADP/O ratios were obtained in analyses based on oxygen flux, JV,O2 (pmol/s/ml) (B) rather than oxygen concentration (A). When initial ADP concentrations are limiting, the ADP/O flux ratio is overestimated by 35% in the conventional analysis (C), owing to the lack of a linear decline in oxygen concentration after ADP stimulation and a sharp peak of oxygen flux (D). At 104 and 15.5 μM initial ADP concentrations, maximum oxygen flux was 6.9- and 2.9-fold above state 4 (ADP regulation ratio; compared with the respiratory control ratio of 7.6 at saturating ADP levels). Evaluation of this integration method was performed by the novel approach of ADP steady-state injection, where the ADP flux set by the pump is divided by the observed steady-state oxygen flux, yielding the total ADP/O flux ratio directly (E; ADP regulation ratio 1.6). After stopping the injection pump, flux returned to state 4, and an ADP titration was performed in the same experiment. The transition periods after switching ADP supply on and off provide the basis for calculating the steady-state ADP level (F).
Figure 2
Figure 2
Oxygen-injection microcalorimetry with mitochondria isolated from rat liver (A) and A. franciscana embryos (B) at limiting oxygen supply (0.050 and 0.092 nmol O2/s/mg protein, respectively). In the first section of each experiment, respiration was coupled to oxidative phosphorylation, whereas the mitochondria were chemically uncoupled in the second section (superimposed). Because oxygen flux was identical for both treatments, the measured heat flux (μW = μJ/s; left ordinate) is directly proportional to the heat/O2 flux ratio (right ordinate). In the coupled state, the heat/O2 flux ratios were (A) 31% (±3.9 SEM; n = 4) and (B) 34% (±3.7 SEM; n = 4) below the uncoupled value, indicating the thermodynamic (enthalpic) efficiency of oxidative phosphorylation.
Figure 3
Figure 3
Dependence of respiration on oxygen partial pressure, pO2, in the absence of ADP at high ATP (state 4) in mitochondria isolated from rat liver (A) and A. franciscana embryos (B). Individual data points of all recordings are shown by symbols (○); the average hyperbolic fits are shown by full lines. The p50 (±SEM; n = 6 preparations; 1–3 replicas each), calculated from hyperbolic fits for individual traces, was significantly different between the rat liver and Artemia mitochondria (P < 0.05; two-tailed t test). (Insets) Hypoxic oxygen regimes were measured in the respirometer during O2 steady-state injection under conditions identical to those in the microcalorimeter (Fig. 2). (Inset A) The average pO2 is given at steady state (n = 3). (Inset B) The average pO2 represents the maximum obtained after 2 min (n = 2). The extent of oxygen limitation during calorimetry experiments is illustrated by transposing these pO2 values onto the profiles for oxygen kinetics (arrows, labeled steady state); (1 kPa is equivalent to 7.501 mmHg.)
Figure 4
Figure 4
Total ADP/O flux ratio as a function of ADP flux, JADP, under aerobic conditions compared with the hypoxic conditions (diamonds with SEM bars). Closed symbols, rat liver mitochondria; and open symbols, A. franciscana mitochondria. Aerobic ADP/O ratios fall markedly as ADP fluxes are lowered to the values observed during the hypoxic experiments. Analysis of 95% confidence limits for hypoxic ADP/O ratios, compared with those for hyperbolic fits of the aerobic data, indicate the differences are statistically significant (P < 0.05). (Inset) Linear slopes of oxygen flux as a function of ADP flux were calculated without the data points at zero ADP flux (state 4) and were identical for rat liver (0.283 ± 0.006 SEM) and A. franciscana mitochondria (0.283 ± 0.014 SEM). Full agreement was established between the steady-state fluxes obtained by ADP-injection respirometry (circles) and average fluxes in ADP-pulse respirometry (triangles). The latter were calculated by dividing the initial ADP concentration and the integrated oxygen concentration by the time interval of the oxygen peak (Fig. 1 C and D).

Similar articles

Cited by

References

    1. Margulis L. Proc Natl Acad Sci USA. 1996;93:1071–1076. - PMC - PubMed
    1. Kasting J F. Science. 1993;259:920–926. - PubMed
    1. Martin W, Müller M. Nature (London) 1998;392:37–41. - PubMed
    1. Gray M W, Burger G, Lang B F. Science. 1999;283:1476–1481. - PubMed
    1. Hochachka P W, Lutz P L, Sick T, Rosenthal M, van den Thillart G, editors. Surviving Hypoxia: Mechanisms of Control and Adaptation. Boca Raton, FL: CRC; 1993.

Publication types

Substances

LinkOut - more resources