. 2000 Sep;12(9):1667-78.
doi: 10.1105/tpc.12.9.1667.

SOS3 function in plant salt tolerance requires N-myristoylation and calcium binding

Affiliations

SOS3 function in plant salt tolerance requires N-myristoylation and calcium binding

M Ishitani et al. Plant Cell. 2000 Sep.

Abstract

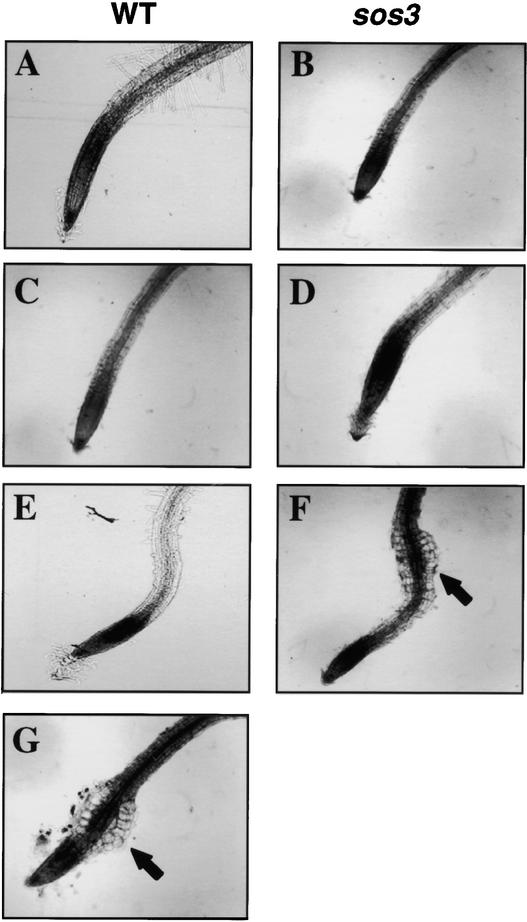
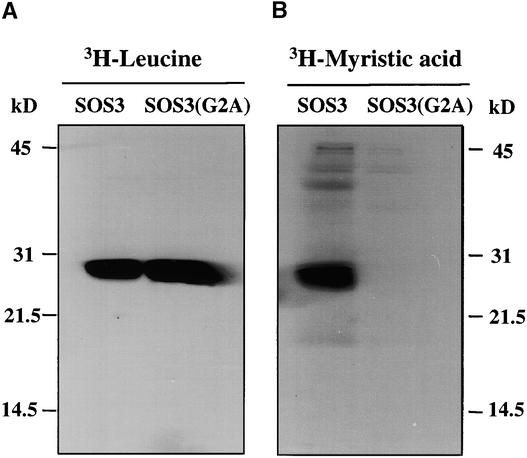
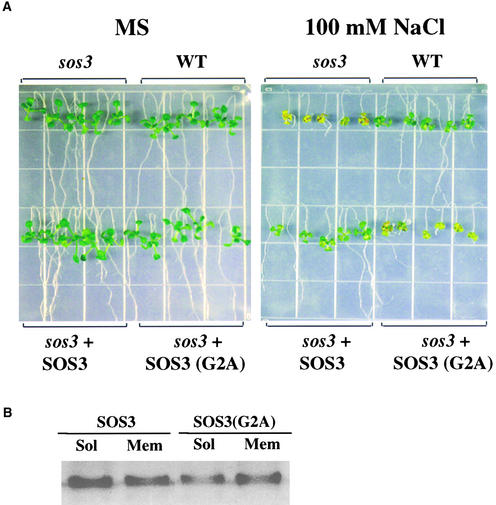
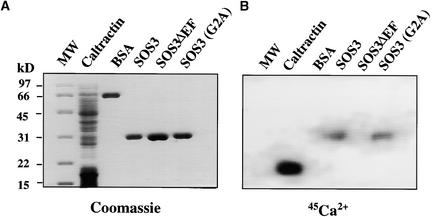
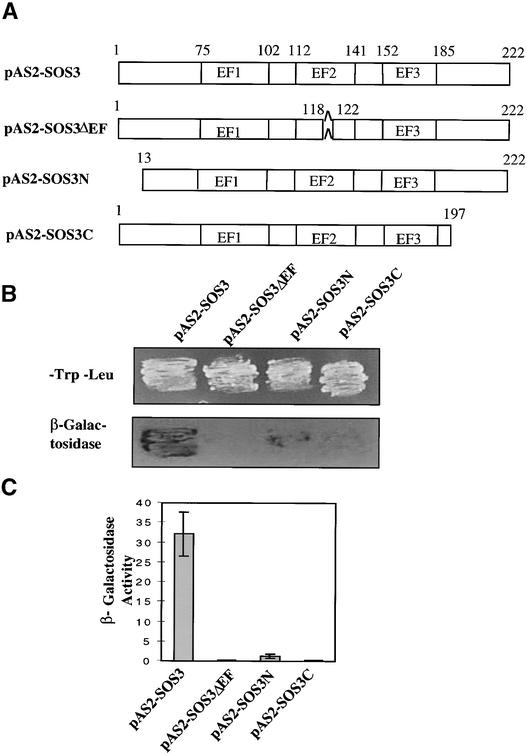
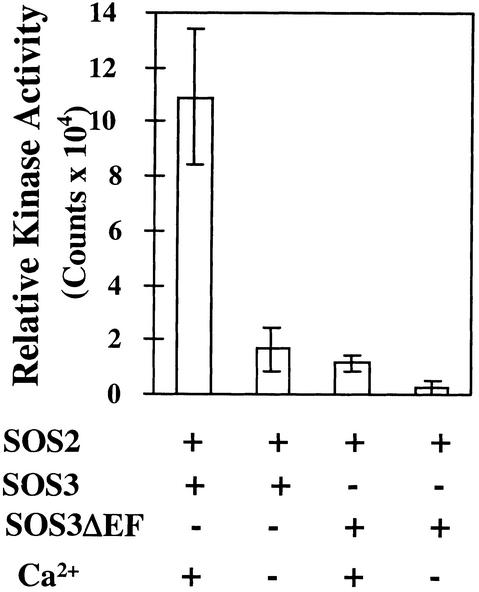
The salt tolerance gene SOS3 (for salt overly sensitive3) of Arabidopsis is predicted to encode a calcium binding protein with an N-myristoylation signature sequence. Here, we examine the myristoylation and calcium binding properties of SOS3 and their functional significance in plant tolerance to salt. Treatment of young Arabidopsis seedlings with the myristoylation inhibitor 2-hydroxymyristic acid caused the swelling of root tips, mimicking the phenotype of the salt-hypersensitive mutant sos3-1. In vitro translation assays with reticulocyte showed that the SOS3 protein was myristoylated. Targeted mutagenesis of the N-terminal glycine-2 to alanine prevented the myristoylation of SOS3. The functional significance of SOS3 myristoylation was examined by expressing the wild-type myristoylated SOS3 and the mutated nonmyristoylated SOS3 in the sos3-1 mutant. Expression of the myristoylated but not the nonmyristoylated SOS3 complemented the salt-hypersensitive phenotype of sos3-1 plants. No significant difference in membrane association was observed between the myristoylated and nonmyristoylated SOS3. Gel mobility shift and (45)Ca(2)+ overlay assays demonstrated that SOS3 is a unique calcium binding protein and that the sos3-1 mutation substantially reduced the capacity of SOS3 to bind calcium. The resulting mutant SOS3 protein was not able to interact with the SOS2 protein kinase and was less capable of activating it. Together, these results strongly suggest that both N-myristoylation and calcium binding are required for SOS3 function in plant salt tolerance.


Figures

Figure 1.
Figure 1.
Treatment of Arabidopsis Seedlings with the Myristoylation Inhibitor HMA Causes Root Tip Swelling under NaCl Stress. sos3 mutant plants also show root tip swelling when treated with NaCl stress. Arrows point to swelling cells. (A) and (B) Root tips of wild-type (WT) and sos3-1 seedlings, respectively, grown on Murashige and Skoog (MS) nutrient salts. (C) and (D) Root tips of wild-type and sos-3-1 seedlings, respectively, treated with MS plus 1 mM HMA. (E) and (F) Root tips of wild-type and sos3-1 seedlings, respectively, treated with MS plus 100 mM NaCl. (G) Root tip of wild-type seedling treated with MS plus 1 mM HMA and 100 mM NaCl.
Figure 2.
Figure 2.
Incorporation of Myristic Acid into SOS3 but Not into SOS3(G2A) in a Rabbit Reticulocyte in Vitro Translation Assay. (A) Control showing that [3H]leucine was incorporated into both proteins. (B) Incorporation of [3H]myristic acid into SOS3 but not SOS3(G2A). Positions of molecular size markers are indicated at left and right in kilodaltons.
Figure 3.
Figure 3.
Expression of SOS3 but Not SOS3(G2A) Suppresses the Salt-Hypersensitive Phenotype of sos3-1 Plants. (A) Examples of T3 plants that are homozygous for the respective transgenes. WT, wild-type parent of sos3 mutant plants. MS, Murashige and Skoog nutrient medium; 100 mM NaCl, MS supplemented with 100 mM NaCl. (B) Protein expression in 35S–SOS3 and 35S–SOS3(G2A) transgenic plants, as detected with anti-SOS3 antisera. Sol, soluble proteins; Mem, microsomal membrane proteins.
Figure 4.
Figure 4.
Expression of SOS3–GFP but not SOS3(G2A)–GFP Suppresses the Salt-Hypersensitive Phenotype of sos3-1 Plants. (A) sos3-1 and wild-type (WT) seedlings, and examples of T3 plants that are homozygous for 35S–SOS3–GFP or 35S–SOS3(G2A)–GFP, after growth for 2 weeks on medium containing 100 mM NaCl. (B) Distribution of SOS3–GFP and SOS3(G2A)–GFP proteins in soluble versus microsomal membrane fractions. sos3-1 seedlings expressing 35S–SOS3–GFP or 35S–SOS3(G2A)–GFP were grown in liquid culture, treated with 75 mM NaCl, and fractionated as described in Methods. Sol, soluble proteins; Mem, microsomal membranes. Arrow indicates the position of SOS3–GFP or SOS3(G2A)–GFP. Molecular size markers are indicated at left in kilodaltons.
Figure 5.
Figure 5.
SOS3 Binds 45Ca2+. (A) and (B) SOS3 and other protein samples were separated by SDS-PAGE and (A) stained with Coomassie blue or (B) electroblotted onto a nitrocellulose membrane, overlayed with 45Ca2+, and autoradiographed. MW, molecular size markers shown at left in kilodaltons; caltractin, bacterial lysate containing recombinant caltractin as a positive control for 45Ca2+ binding; BSA, negative control for 45Ca2+ binding; SOS3, His–SOS3; SOS3ΔEF, His-tagged SOS3 containing the sos3-1 mutation; SOS3(G2A), His–SOS3(G2A).
Figure 6.
Figure 6.
SOS3 Does Not Exhibit a Calcium- or EGTA-Induced Mobility Shift on SDS-PAGE. (A) His–SOS3 does not show a mobility shift when calcium or EGTA is included in the sample buffer. (B) Neither His–SOS3 nor GST–SOS3 shows a mobility shift even when calcium or EGTA is included in the polyacrylamide gels. MW, molecular size markers, shown at left in kilodaltons; caltractin (in bacterial lysate) and calmodulin, positive controls for the mobility shift assays; BSA, negative control.
Figure 7.
Figure 7.
The sos3-1 Mutation as Well as N- or C-Terminal Truncations in SOS3 Disrupts Its Interaction with SOS2 in the Yeast Two-Hybrid System. (A) Diagram of the structures of the bait proteins. The sos3-1 mutation is represented by SOS3ΔEF. pAS2-SOS3N, N-terminal truncation of SOS3; pAS2-SOS3C, C-terminal truncation of SOS3. (B) Yeast growth and two-hybrid interactions. Upper panel, growth of yeast cells harboring the pACT-SOS2 prey and various baits. Lower panel, β-galactosidase assay. (C) Quantitative results of the β-galactosidase assay with pACT-SOS2 as prey. Error bars indicate sd (n = 3).
Figure 8.
Figure 8.
The sos3-1 Mutation Reduces the Efficacy of SOS3 in the Activation of SOS2 Kinase Activity. The sos3-1 mutation is represented by SOS3ΔEF. Phosphorylation assays were performed by using the p3 peptide as a substrate (see Methods). (+) and (−) indicate presence or absence, respectively, of the protein or Ca2+ ions. Error bars indicate sd (n = 3).

References

    1. Ames, J.B., Ishima, R., Tanaka, T., Gordon, J.I., Stryer, L., and Ikura, M. (1997). Molecular mechanisms of calcium-myristoyl switches. Nature 389, 198–202. - PubMed
    1. Deichaite, I., Casson, L.P., Ling, H.P., and Resh, M.D. (1988). In vitro synthesis of pp60v-src: Myristoylation in a cell-free system. Mol. Cell. Biol. 8, 4295–4301. - PMC - PubMed
    1. Dizhoor, A.M., Chen, C.K., Olshevskaya, E., Sinelnikova, V.V., Philipov, P., and Hurley, J.B. (1993). Role of acylated amino terminus of recoverin in Ca2+-dependent membrane interaction. Science 259, 829–832. - PubMed
    1. Ellard-Ivey, M., Hopkins, R.B., White, T.J., and Lomax, T.L. (1999). Cloning, expression and N-terminal myristoylation of CpCPK1, a calcium-dependent protein kinase from zucchini (Cucurbita pepo L.). Plant Mol. Biol. 39, 199–208. - PubMed
    1. Galbiati, F., Guzzi, F., Magee, A.I., Milligan, G., and Parenti, M. (1996). Chemical inhibition of myristoylation of the G-protein Gil alpha by 2-hydroxymyristate does not interfere with its palmitoylation or membrane association: Evidence that palmitoylation, but not myristoylation, regulates membrane attachment. Biochem. J. 313, 717–720. - PMC - PubMed

Publication types

MeSH terms