. 2000 Oct 1;20(19):7384-93.
doi: 10.1523/JNEUROSCI.20-19-07384.2000.

Tumor necrosis factor receptor-associated factor 6 (TRAF6) deficiency results in exencephaly and is required for apoptosis within the developing CNS

Affiliations

Tumor necrosis factor receptor-associated factor 6 (TRAF6) deficiency results in exencephaly and is required for apoptosis within the developing CNS

M A Lomaga et al. J Neurosci. .

Abstract

Tumor necrosis factor receptor-associated factors (TRAFs) are adaptor proteins important in mediating intracellular signaling. We report here that targeted deletion of traf6 greatly increases the frequency of failure of neural tube closure and exencephaly in traf6 (-/-) mice. The penetrance of this defect is influenced by genetic background. Neural tube fusion requires the coordination of several biological processes, including cell migration invoked by contact-dependent signaling, cell proliferation, and programmed cell death (PCD). To gain greater insight into the role of TRAF6 in these processes, neural development and migration within the CNS of traf6 (-/-) mice and controls were assessed through temporal examination of a number of immunohistochemical markers. In addition, relative levels of cellular proliferation and PCD were examined throughout embryonic development using bromodeoxyuridine (BrdU) and in situ terminal deoxynucleotidyl transferase-mediated dUTP biotinylated nick end labeling (TUNEL), respectively. The data suggest that loss of TRAF6 does not significantly alter the level of cellular proliferation or the pattern of neural differentiation per se, but rather regulates the level of PCD within specific regions of the developing CNS. Substantial reductions in TUNEL were observed within the ventral diencephalon and mesencephalon in exencephalic traf6 (-/-) embryos. Our results demonstrate a novel and prominent role for TRAF6 in the regional control of PCD within the developing CNS.


Figures
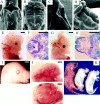
Fig. 1.
Fig. 1.
Exencephaly in TRAF6-deficient embryos.A–D, Comparison of representative traf6(−/−) and (+/−) embryos at E10.5 by scanning electron microscopy.A, On-axis caudal view of the roof of the hindbrain (fourth ventricle) of a traf6 (+/−) embryo at E10.5 showing NT fusion in progress. B, Comparative view of atraf6 (−/−) littermate showing failure of NT fusion.C, Off-axis caudal view of the roof of the hindbrain of an E10.5 traf6(+/−) embryo. D, Comparative off-axis caudal view of an E10.5 traf6(−/−) embryo. E–H, Overview and corresponding cross sections of representative traf6 (+/−) and exencephalic (−/−) embryos at E13.5. E, Anterior overview and (F) cross section of a representativetraf6 (+/−) embryo. G, Anterior overview and (H) cross section of a representativetraf6 (−/−) embryo. Lines in overviews indicate the relative level of the corresponding thionin-stained cross section. I, Overview of an E14.5 traf6(+/−) embryo. J, Overview of two E14.5 exencephalictraf6 (−/−) embryos. K, Overviews of a viable traf6 (+/−) and two deceased exencephalic (−/−) littermates at P1. Note the lack of cephalic tissue intraf6 (−/−) as a result of injury during birth. Scale bars (E–J): 1 mm.
Fig. 2.
Fig. 2.
Expression of traf6 during embryonic development. Northern blot analysis of traf6mRNA prepared from wild-type adult tissues and whole embryos at E7, E11, E15, and E17, showing relative levels of traf6expression. panc, Pancreas; thyr, thyroid; thym, thymus; submx, submaxillary; test, testes; ovar, ovary;prost, prostate; epid, epididymus.B, In situ hybridization of a whole mount of an E9.5 wild-type embryo showing traf6 expression in the developing brain. The highest levels of expression occur in the forebrain (arrowhead), with lower expression in the midbrain and hindbrain regions. C, Rostral view (magnified) of the embryo in B showingtraf6 expression in the developing forebrain (arrowhead).
Fig. 3.
Fig. 3.
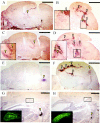
Analysis of p75 expression in exencephalic TRAF6-deficient embryos. Paired photomicrographs (AB,CD, EF,GH) of sagittal sections from representative traf6 (+/−) (A,C, E, G) and exencephalic (−/−) (B, D, F,H) littermates stained with anti-p75 antibody. Section pairs are equivalent with respect to their medial-lateral position to the sagittal midline. Sections are oriented such that rostral structures are located to the left and caudal structures to the right. Colored arrowheads denote the following structures:green, facial nucleus; red, trigeminal ganglion; black, p75+ Purkinje neurons of the cerebellum; yellow, p75+ cortical axons; orange, p75+ inputs of developing fimbria-fornix;blue, p75+ neurons of the developing thalamus; white, optic chiasma; gray, p75+ axons innervating dorsal spinal cord.A, B, Sagittal sections from E14.5traf6 (+/−) and (−/−) embryos, 200 μm from the sagittal midline. C, D, Matched E14.5 sections 500 μm from the sagittal midline. E,F, Sagittal sections from E18.5 traf6(+/−) and (−/−) embryos, 800 μm from the sagittal midline.G, H, E18.5 sections showing the midbrain and hindbrain, 800 μm from the sagittal midline.I, Sagittal section from an exencephalic E14.5traf6 (−/−) embryo, 300 μm from the sagittal midline, showing the transition region of the facial nucleus. Scale bars: ∼1 mm.
Fig. 4.
Fig. 4.
Immunohistochemical characterization of exencephalic TRAF6-deficient embryos. Each photomicrograph pair (AB,CD, EF,GH) shows sagittal sections from the same traf6 (+/−) (A,C, E, G) or exencephalic (−/−) (B, D, F,H) littermates shown in Figure 3. Sections are oriented such that rostral structures are located to theleft and caudal structures to the right.A, B, Calbindin staining oftraf6 (+/−) and (−/−) littermates at E18.5. Sections are ∼750 μm from the sagittal midline. C,D, Calretinin staining of E18.5 traf6(+/−) and (−/−) embryos 850 μm from the sagittal midline.E, F, Tyrosine hydroxylase staining of E18.5 traf6 (+/−) and (−/−) embryos 950 μm from the sagittal midline. Arrowheads denote particular groups of immunopositive neurons within the brains of traf6 (+/−) embryos or their cellular equivalents in traf6 (−/−) mice as indicated in the Figure 3 legend. Scale bars, 1 mm.Insets represent threefold magnifications of the adjacent boxed regions. G,H, Neuropeptide Y staining of E14.5 thyroid gland (yellow arrowhead) of traf6 (+/−) and (−/−) embryos 100 μm from the sagittal midline.Insets show cross sections of Rathke's pouch.
Fig. 5.
Fig. 5.
BrdU incorporation in exencephalic TRAF6-deficient embryos. A, B, Composite photomicrographs of thionin-stained sagittal sections of E16.5traf6 (+/−) and (−/−) embryos, respectively.Colored arrowheads indicate comparable cellular regions as determined by morphology, BrdU labeling, and immunohistochemical data. C, F, Sagittal overviews of BrdU labeling within the cerebral cortex of E14.5 traf6(+/−) and exencephalic (−/−) embryos, respectively.D, Magnified view of the boxed regionshown in C. E, Additional view of BrdU labeling within the rostral cortex of a traf6 (+/−) embryo at a similar level. G, Magnified view of theboxed region shown in F.H, Additional view of BrdU labeling within the cortex of a traf6 (−/−) embryo at a level similar to that shown in E. In G andH, the arrowheads denote regions of ectopic cell proliferation. Scale bars, 1 mm.
Fig. 6.
Fig. 6.
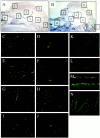
Reduction of programmed cell death in the CNS of exencephalic TRAF6-deficient embryos. A,B, Morphological summaries of the regions analyzed for TUNEL-positive neurons in E15.5 traf6 (+/−) and exencephalic (−/−) embryos, respectively. C,E, Two representative examples of TUNEL staining within the developing diencephalon (hypothalamus, region 4) of E14.5traf6 (+/−) embryos. D,F, Sections of traf6 (−/−) littermates comparable with those in C and E.G, H, TUNEL staining in region 4 of E15.5traf6 (+/−) and (−/−) embryos, respectively.I, J, TUNEL staining within the diencephalon (thalamus, region 6) of E14.5 traf6 (+/−) and (−/−) embryos, respectively. K–N, Representative examples of TUNEL staining within the (K) medulla oblongata (region 7), (L) trigeminal ganglion, (M) tongue epithelium, and (N) nasal epithelium (region 0) in E14.5traf6 (−/−) embryos.

References

    1. Arch RH, Gedrich RW, Thompson CB. Tumor necrosis factor receptor-associated factors (TRAFs): a family of adapter proteins that regulates life and death. Genes Dev. 1998;12:2821–2830. - PubMed
    1. Berk M, Desai SY, Heyman HC, Colmenares C. Mice lacking the ski proto-oncogene have defects in neurulation, craniofacial patterning, and skeletal muscle development. Genes Dev. 1997;11:2029–2039. - PMC - PubMed
    1. Bertin J, Nir WJ, Fischer CM, Tayber OV, Errada PR, Grant JR, Keilty JJ, Gosselin ML, Robison KE, Wong GH, Glucksmann MA, DiStefano PS. Human CARD4 protein is a novel CED-4/Apaf-1 cell death family member that activates NF-kappa B. J Biol Chem. 1999;274:12955–12958. - PubMed
    1. Cao Z, Xiong J, Takeuchi M, Kurama T, Goeddel DV. TRAF6 is a signal transducer for interleukin-1. Nature. 1996;383:443–446. - PubMed
    1. Copp AJ, Brook FA, Estibeiro JP, Shum ASW, Cockroft DL. The embryonic development of mammalian neural tube defects. Prog Neurobiol. 1990;35:363–403. - PubMed

MeSH terms