Clinical Trial
. 2000 Oct 1;20(19):7438-45.
doi: 10.1523/JNEUROSCI.20-19-07438.2000.

Expectation of pain enhances responses to nonpainful somatosensory stimulation in the anterior cingulate cortex and parietal operculum/posterior insula: an event-related functional magnetic resonance imaging study

Affiliations
Clinical Trial

Expectation of pain enhances responses to nonpainful somatosensory stimulation in the anterior cingulate cortex and parietal operculum/posterior insula: an event-related functional magnetic resonance imaging study

N Sawamoto et al. J Neurosci. .

Abstract

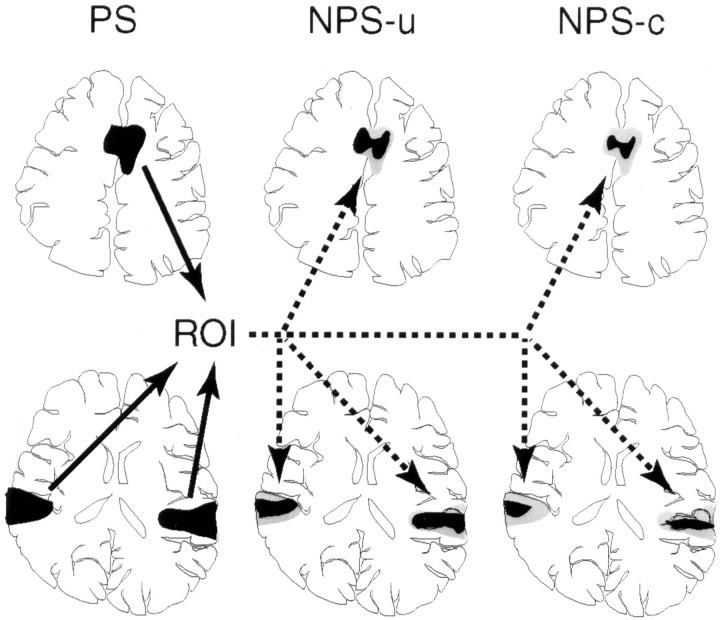
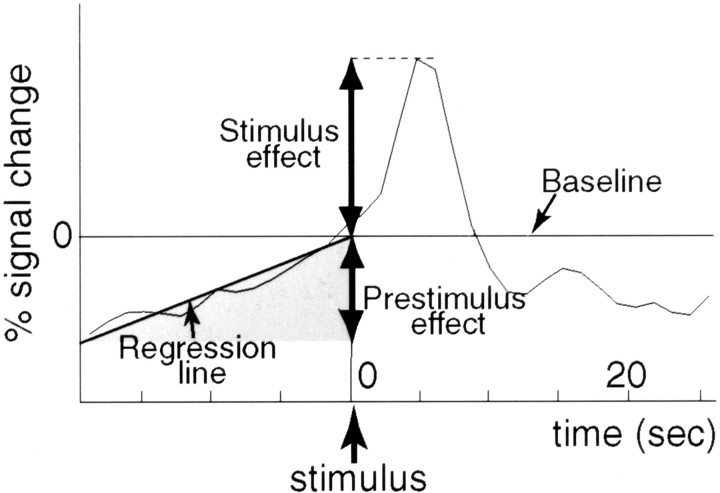
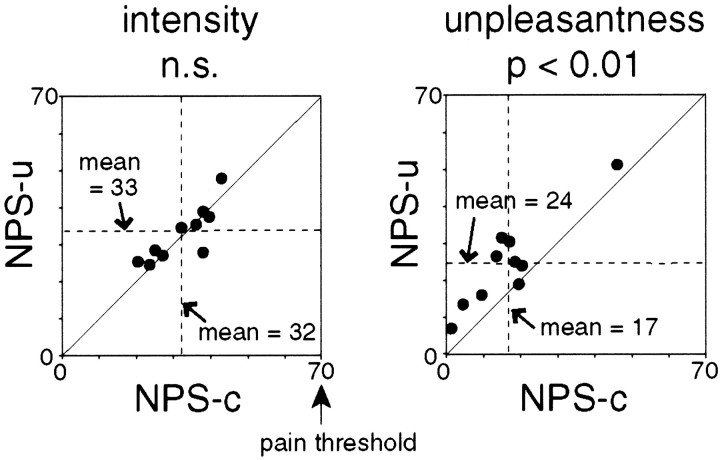
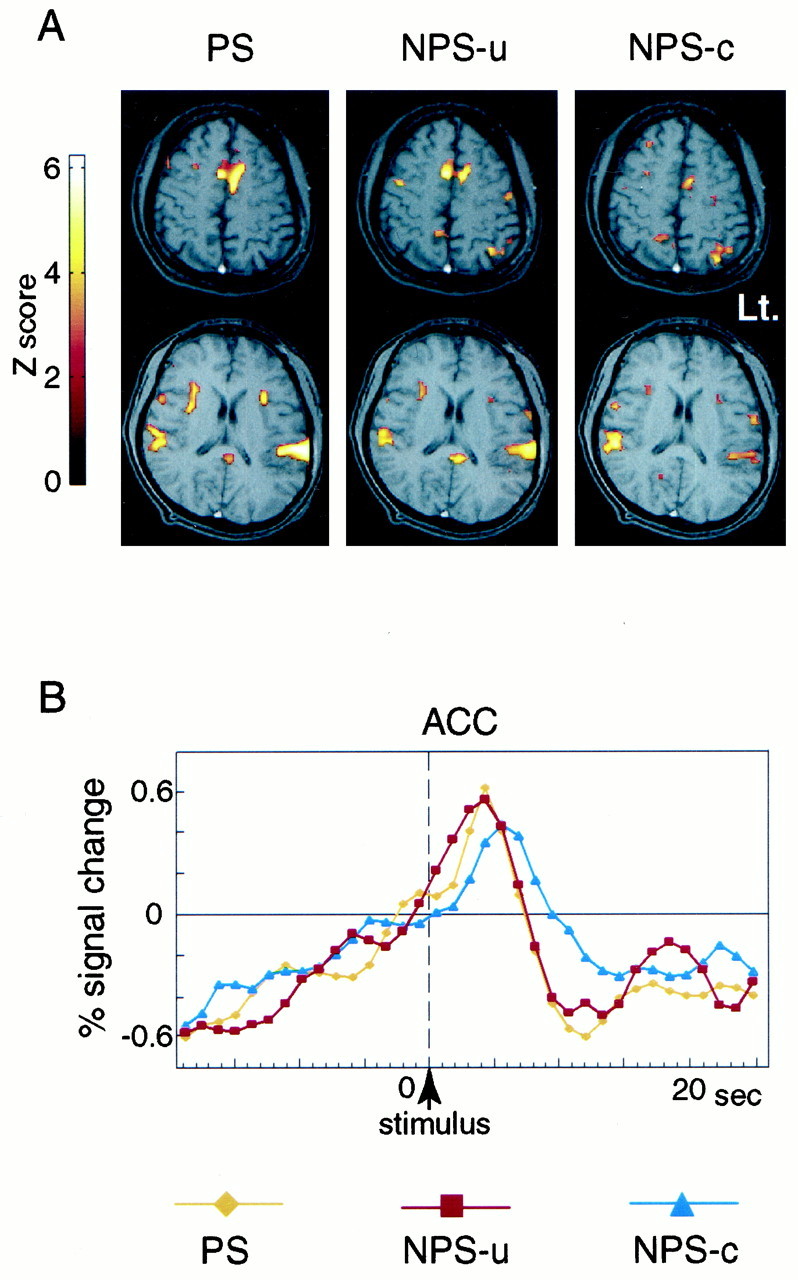
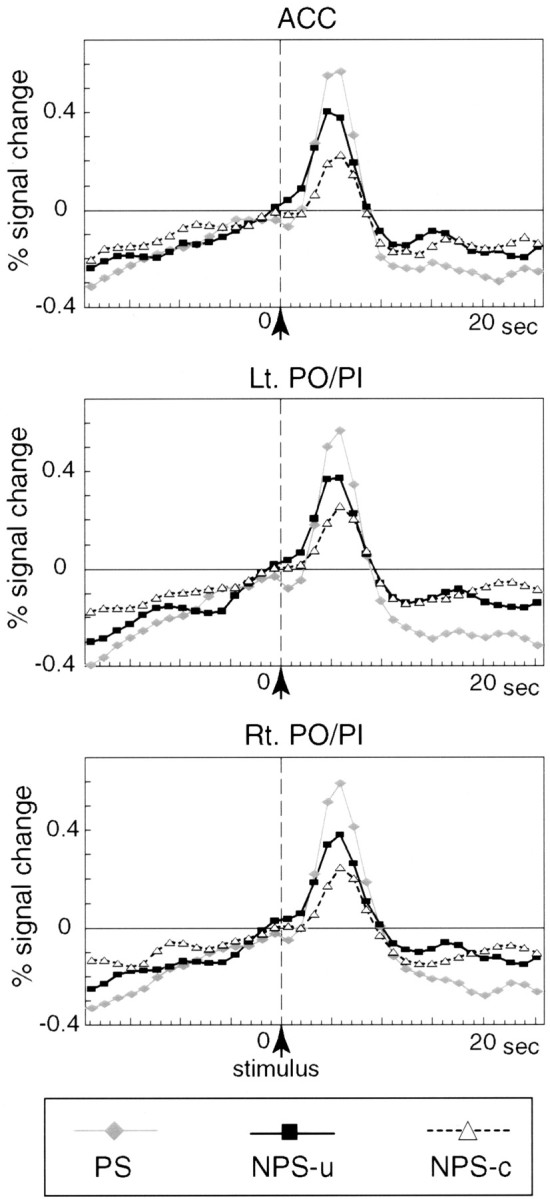
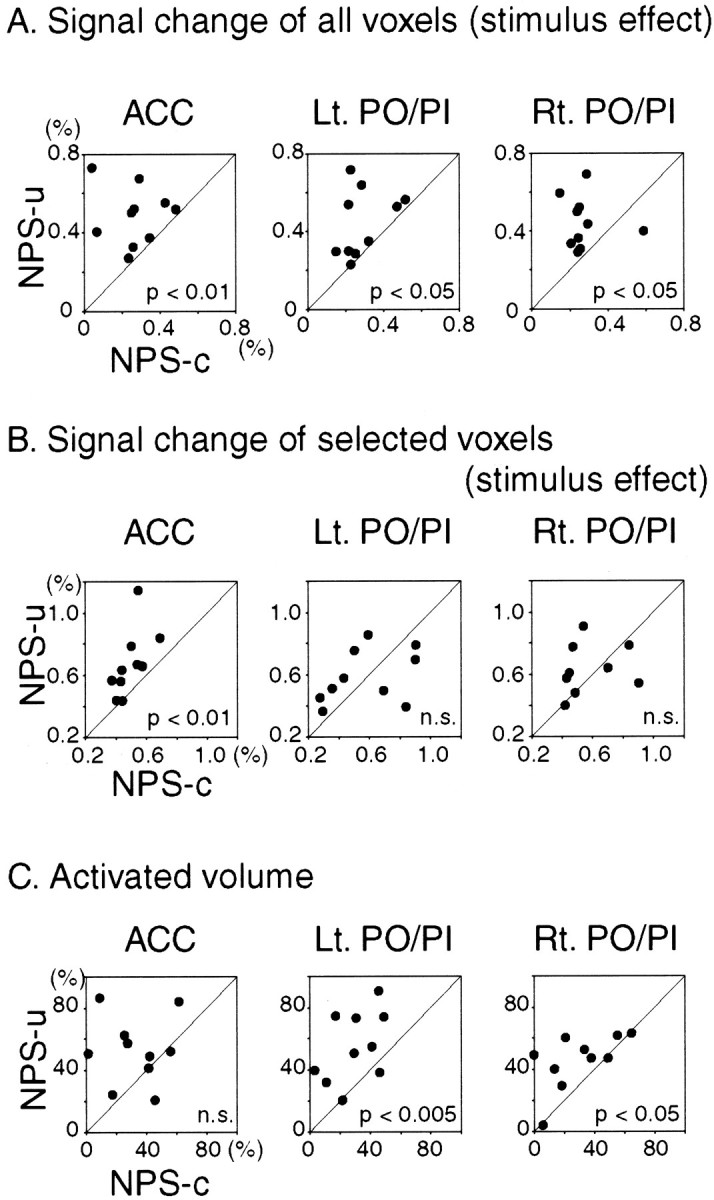
Although behavioral studies suggest that pain distress may alter the perception of somatic stimulation, neural correlates underlying such alteration remain to be clarified. The present study was aimed to test the hypothesis that expectation of pain might amplify brain responses to somatosensory stimulation in the anterior cingulate cortex (ACC) and the region including parietal operculum and posterior insula (PO/PI), both of which may play roles in regulating pain-dependent behavior. We compared brain responses with and subjective evaluation of physically identical nonpainful warm stimuli between two psychologically different contexts: one linked with pain expectation by presenting the nonpainful stimuli randomly intermixed with painful stimuli and the other without. By applying the event-related functional magnetic resonance imaging technique, brain responses to the stimuli were assessed with respect to signal changes and activated volume, setting regions of interest on activated clusters in ACC and bilateral PO/PI defined by painful stimuli. As a result, the uncertain expectation of painful stimulus enhanced transient brain responses to nonpainful stimulus in ACC and PO/PI. The enhanced responses were revealed as a higher intensity of signal change in ACC and larger volume of activated voxels in PO/PI. Behavioral measurements demonstrated that expectation of painful stimulus amplified perceived unpleasantness of innocuous stimulus. From these findings, it is suggested that ACC and PO/PI are involved in modulation of affective aspect of sensory perception by the uncertain expectation of painful stimulus.


Figures

Fig. 1.
Fig. 1.
Schematic representation of the ROI setting in a representative individual subject. First, activated clusters under the painful stimulus (PS) condition were identified, and those clusters on the ACC and bilateral PO/PI served as ROIs, which were then applied to the images of nonpainful warm stimulus in uncertain condition (NPS-u) and nonpainful warm stimulus in certain condition (NPS-c) in the same subject.Black areas indicate the actual activation in each condition, and gray areas represent ROIs identical to the activation in the PS condition. Note that ROIs are the same brain areas for NPS-u and NPS-c and are determined independently of these two conditions in each subject.
Fig. 2.
Fig. 2.
Schematic representation of the method used for evaluating the time course data of individual subjects. A regression line was calculated using the data during prestimulus phase under each condition for each subject. The intercept of the regression line at the time of the stimulus presentation served as the baseline signal intensity from which the signal change relating to the stimulus was divided into stimulus effect and prestimulus effect. The stimulus effect was assessed as the peak signal intensity, and the prestimulus effect was assessed as the signal intensity at the time of the first analyzed scan estimated from the regression line. Both effects were represented by the percent signal change with respect to the baseline (percent difference).
Fig. 3.
Fig. 3.
Subjective evaluation of nonpainful warm stimulus in uncertain condition (NPS-u) and nonpainful warm stimulus in certain condition (NPS-c). Scores of individual subjects and mean scores across all subjects are shown. Diagonal line indicates equal scores for NPS-u and NPS-c conditions. Subjects rated intensity and unpleasantness of each stimulus separately. The unpleasantness score of NPS-u was significantly higher than that of NPS-c, whereas the intensity scores did not show a significant difference between the two conditions. Statistical analysis was conducted with Wilcoxon signed rank tests.
Fig. 4.
Fig. 4.
Activated areas for PS, NPS-u, and NPS-c conditions (A) and averaged time course data of activated cluster in ACC for each condition (B), obtained from a single subject. A, Activated areas, which showed significant transient signal increase time-locked to the stimulus, are superimposed on the subject's own structural MRI. Activation is seen in ACC, bilateral PO/PI, anterior insula, and other areas. The activated areas look similar in PS, NPS-u, and NPS-c conditions. The right side of the brain is shown on the left side of the image. Brighter color represents a higher statistical significance. B, Averaged signals across 20 trials at the activated cluster in ACC are shown for PS, NPS-u, and NPS-c conditions. The verticaldotted line indicates the time of the stimulus presentation. Transient signal increase after the stimulus (stimulus effect) and gradual signal increase before the stimulus (prestimulus effect) are observed. The stimulus effect is highest in PS and higher in NPS-u compared with NPS-c condition.
Fig. 5.
Fig. 5.
Averaged time course data of all voxels within each ROI. Signal changes in ACC and left and right PO/PI under each of the PS, NPS-u, and NPS-c conditions were averaged across all subjects. The vertical dotted line indicates the time of the stimulus presentation. Transient signal increase after the stimulus (stimulus effect) and gradual signal increase before the stimulus (prestimulus effect) are observed in all ROIs under all conditions. In all ROIs, the stimulus effects are highest in PS and higher in NPS-u compared with NPS-c condition.
Fig. 6.
Fig. 6.
Comparison of NPS-u with NPS-c conditions. Eachdot represents individual subject data. Diagonal line indicates equal responses in NPS-u and NPS-c conditions. The two conditions are compared with respect to signal change and activated volume setting ROI on ACC and bilateral PO/PI. For signal change comparison, the time course data of each subject are averaged over voxels within ROI: in one analysis averaged over all voxels (A) and in the other analysis averaged over selected voxels in each condition (i.e., Z > 3.09) (B). Transient signal changes after the stimulus (stimulus effect; see Fig. 2) are shown. For comparing activated volume, the number of activated voxels above the threshold (i.e., Z > 3.09) in each condition was computed within each ROI and divided by the ROI voxel number (C). As for the signal change of all voxels (A), stimulus effect averaged over all voxels within ROI revealed significantly larger change in NPS-u than NPS-c condition in ACC and left and right PO/PI. As for the signal change of selected voxels (B), stimulus effect averaged over the selected voxels within ROI revealed significantly larger change in NPS-u than in NPS-c condition in ACC. In contrast, the response in bilateral PO/PI was not different between the two conditions. In regards to the activated volume (C), the proportions of the activated volume in NPS-u were significantly larger than NPS-c in bilateral PO/PI. In contrast, the difference in ACC did not reach statistical significance. In summary, higher intensity of signal change after the stimulus in ACC and larger volume of activated voxels in bilateral PO/PI are consistently observed, which suggests enhanced brain responses in NPS-u compared with NPS-c. Statistical analyses were conducted using pairedt tests.

References

    1. Baker JT, Donoghue JP, Sanes JN. Gaze direction modulates finger movement activation patterns in human cerebral cortex. J Neurosci. 1999;19:10044–10052. - PMC - PubMed
    1. Barsky AJ, Borus JF. Functional somatic syndromes. Ann Intern Med. 1999;130:910–921. - PubMed
    1. Becerra LR, Breiter HC, Stojanovic M, Fishman S, Edwards A, Comite AR, Gonzalez RG, Borsook D. Human brain activation under controlled thermal stimulation and habituation to noxious heat: an fMRI study. Magn Reson Med. 1999;41:1044–1057. - PubMed
    1. Berthier M, Starkstein S, Leiguarda R. Asymbolia for pain: a sensory-limbic disconnection syndrome. Ann Neurol. 1988;24:41–49. - PubMed
    1. Casey KL, Minoshima S, Berger KL, Koeppe RA, Morrow TJ, Frey KA. Positron emission tomographic analysis of cerebral structures activated specifically by repetitive noxious heat stimuli. J Neurophysiol. 1994;71:802–807. - PubMed

Publication types