. 2000 Oct;66(10):4193-9.
doi: 10.1128/AEM.66.10.4193-4199.2000.

Seasonal population dynamics and interactions of competing bacteriophages and their host in the rhizosphere

Affiliations

Seasonal population dynamics and interactions of competing bacteriophages and their host in the rhizosphere

K E Ashelford et al. Appl Environ Microbiol. 2000 Oct.

Abstract

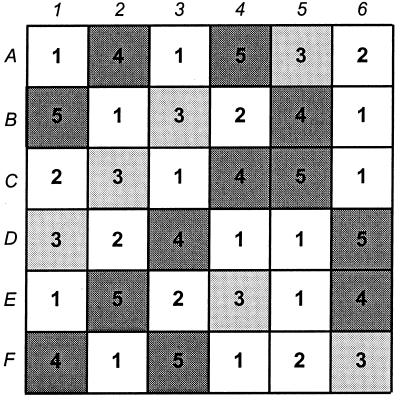
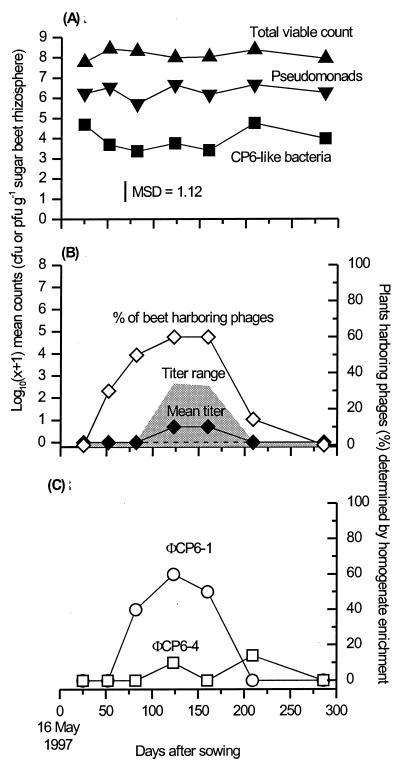
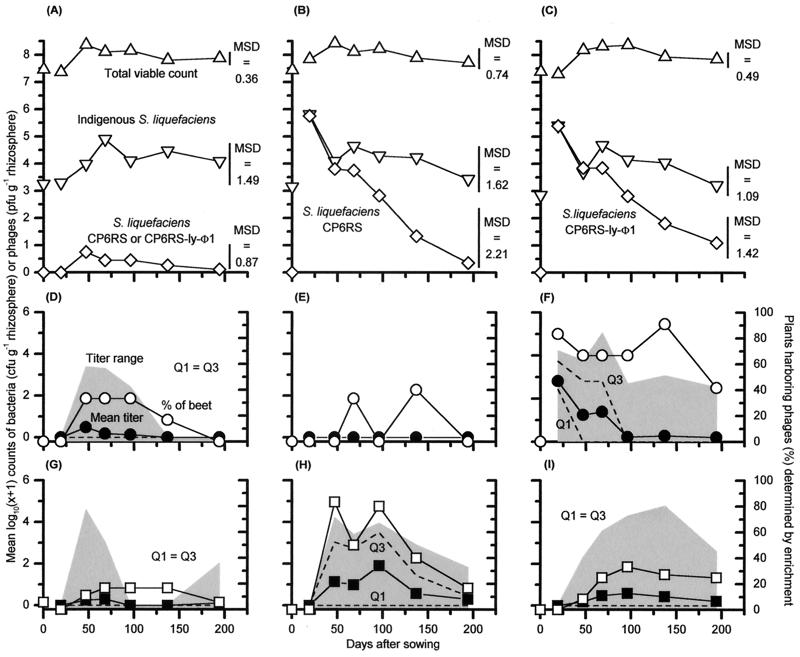
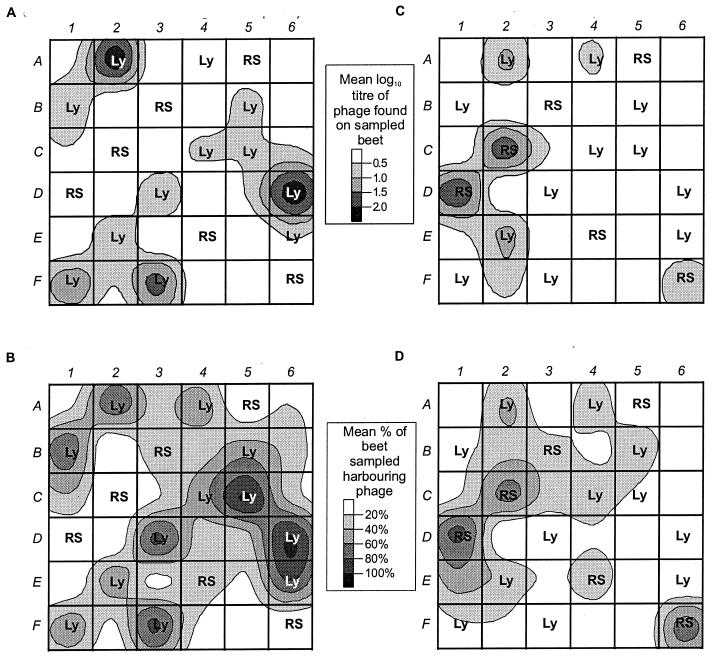
We describe two prolonged bacteriophage blooms within sugar beet rhizospheres ensuing from an artificial increase in numbers of an indigenous soil bacterium. Further, we provide evidence of in situ competition between these phages. This is the first in situ demonstration of such microbial interactions in soil. To achieve this, sugar beet seeds were inoculated with Serratia liquefaciens CP6RS or its lysogen, CP6RS-ly-phi 1. These were sown, along with uninoculated seeds, in 36 field plots arranged in a randomized Latin square. The plots were then sampled regularly over 194 days, and the plants were assayed for the released bacteria and any infectious phages. Both the lysogen and nonlysogen forms of CP6RS survived equally well in situ, contradicting earlier work suggesting lysogens have a competitive disadvantage in nature. A Podoviridae phage, identified as phi CP6-4, flourished on the nonlysogen-inoculated plants in contrast to those plants inoculated with the lysogen. Conversely, the Siphoviridae phage phi CP6-1 (used to construct the released lysogen) was isolated abundantly from the lysogen-treated plants but almost never on the nonlysogen-inoculated plants. The uninoculated plants also harbored some phi CP6-1 phage up to day 137, yet hardly any phi CP6-4 phages were found, and this was consistent with previous years. We show that the different temporal and spatial distributions of these two physiologically distinct phages can be explained by application of optimal foraging theory to phage ecology. This is the first time that such in situ evidence has been provided in support of this theoretical model.


Figures

FIG. 1
FIG. 1
Arrangement of plots during 1998 field experiment. Each square represents a separate plot. Plots were assigned to one of five treatments by following a randomized Latin square arrangement. The squares shaded light gray indicate the plots containing plants inoculated with CP6RS, squares shaded dark gray indicate the plots containing plants inoculated with CP6RS-ly-Φ1, and unshaded squares represent plots containing uninoculated plants, either by design (i.e., treatment 1), or through inoculation failure (i.e., treatment 2); see the text for descriptions of treatments.
FIG. 2
FIG. 2
Temporal variation in abundance of bacteria and phages within the sugar beet rhizosphere recorded during 1997. (A) Bacteria on sugar beets. Bacterial counts were determined on TSBA plates to give total viable counts (apex-up triangles), on PSIA plates to give total pseudomonad counts (apex-down triangles), and on SSM plates to give total S. liquefaciens CP6 counts (squares). (B) Total CP6 phages on sugar beets. (C) Breakdown of CP6 phage population into its two major components. Phage titers (panel B, solid diamonds) were estimated from freshly prepared rhizosphere homogenates by plaque counting. The percentages of sugar beets harboring CP6 phages generally (panel B, open diamonds) and phages ΦCP6-1 and ΦCP6-4 in particular (panel C, circles and squares, respectively) were determined after homogenates had been nutrient enriched and incubated overnight. Each plotted point represents 10 replicate sugar beets, except for day 209, when 14 plants were sampled. MSD, minimum significant difference at a P value of 0.05 (8). The gray shading (panel B) indicates the range of phage titers recorded, while the dashed line shows the position of both the upper and lower quartiles for this data (i.e., both Q1 and Q3 = 0 for all means shown).
FIG. 3
FIG. 3
1998 field experiment, showing the fate of the S. liquefaciens CP6RS and CP6RS-ly-Φ1 releases within the sugar beet rhizospheres and the consequent phage blooms they triggered. Bacterial counts (A to C) are compared with those of phage ΦCP6-1 (D to F) and phage ΦCP6-4 (G to I). Due to the nonsurvival of S. liquefaciens CP6SpN in situ, a comparison is made between uninoculated beets (a pooling of results from treatments 1 and 2) (A, D, and G), nonlysogen-treated beets (treatment 3) (B, E, and H), and lysogen-treated beets (pooled results from treatments 4 and 5) (C, F, and I). Because of this pooling of results, each plotted point represents either 18 plants (uninoculated beets), 6 plants (nonlysogen-treated beets), or 12 plants (lysogen-treated beets). See the text for an explanation of why the treatments were combined. Means of the phage titers are indicated by solid symbols. The gray shading indicates the range of the phage titers, whereas the dashed lines show the positions of both the upper (Q3) and lower (Q1) quartiles of this data. Also shown (D to I) are phage abundances detected after nutrient enrichment (open symbols).
FIG. 4
FIG. 4
Distribution of phages within the field site over the entire 1998 experiment, shown as contour plots of average phage abundance. (A and B) Abundance of phage ΦCP6-1 as determined by plaque counts from fresh homogenates (A) and as a percentage of sugar beets sampled after enrichment (B). (C and D) Distribution of ΦCP6-4 as determined by plaque counts from fresh homogenates (C) and after enrichment (D). Means were determined from the sum of all counts over the entire season. RS, plots containing CP6RS-inoculated plants (i.e., treatment 3); Ly, plots containing lysogen-inoculated plants (i.e., treatments 4 and 5). The unlabeled plots are uninoculated controls. Plaque counts are given as PFU per gram of rhizosphere.

References

    1. Abedon S T. Selection for bacteriophage latent period length by bacterial density: a theoretical examination. Microb Ecol. 1989;18:79–88. - PubMed
    1. Adams M H. Bacteriophages. New York, N.Y: Interscience Publishers; 1959.
    1. Ashelford K E, Day M J, Bailey M J, Lilley A K, Fry J C. In situ population dynamics of bacterial viruses in a terrestrial environment. Appl Environ Microbiol. 1999;65:169–174. - PMC - PubMed
    1. Ashelford K E, Fry J C, Bailey M J, Jeffries A R, Day M J. Characterization of six bacteriophages of Serratia liquefaciens CP6 isolated from the sugar beet phytosphere. Appl Environ Microbiol. 1999;65:1959–1965. - PMC - PubMed
    1. Bergh O, Borcheim K Y, Bratbak G, Heldal M. High abundance of viruses found in aquatic environments. Nature. 1989;340:467–468. - PubMed

Publication types

LinkOut - more resources