

Increased immunoglobulin A levels in milk by over-expressing the murine polymeric immunoglobulin receptor gene in the mammary gland epithelial cells of transgenic mice
- PMID: 11012775
- PMCID: PMC2327069
- DOI: 10.1046/j.1365-2567.2000.00094.x
Increased immunoglobulin A levels in milk by over-expressing the murine polymeric immunoglobulin receptor gene in the mammary gland epithelial cells of transgenic mice
Abstract
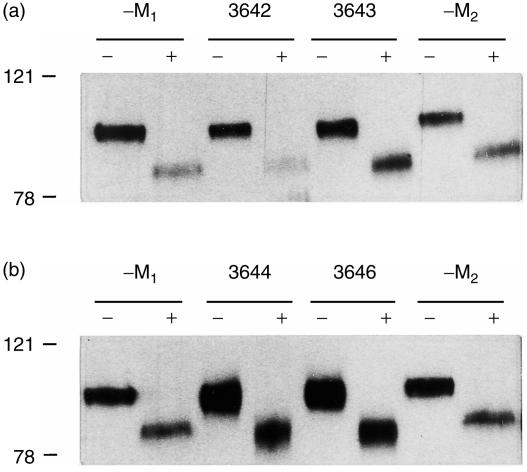
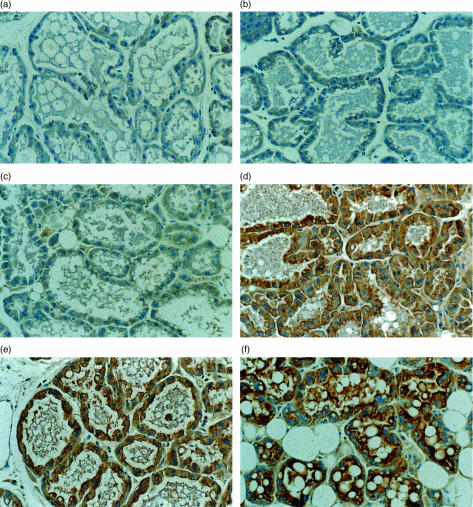
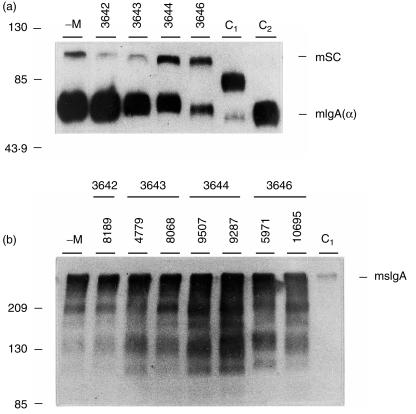
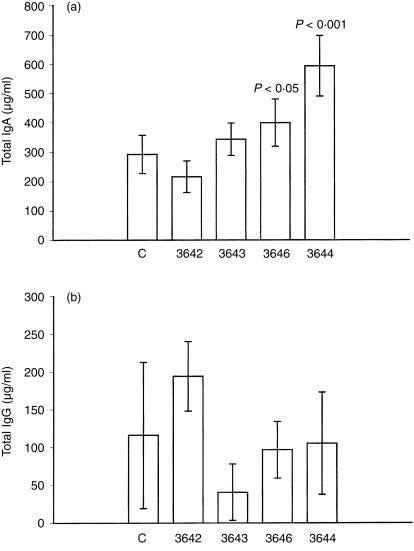
The polymeric immunoglobulin receptor (pIgR) transports dimeric immunoglobulin A (dIgA) across the epithelial cell layers into the secretions of various mucosal and glandular surfaces of mammals. At these mucosal sites, such as the gastrointestinal tract, respiratory tract, urogenital tract and the mammary glands, dIgA protects the body against pathogens. The pIgR binds dIgA at the basolateral side and transports it via the complex mechanism of transcytosis to the apical side of the epithelial cells lining the mucosa. Here, the extracellular part of the receptor is cleaved to form the secretory component (SC), which remains associated to dIgA, thereby protecting it from degradation in the secretions. One pIgR molecule transports only one dIgA molecule (1 : 1 ratio) and the pIgR is not recycled after each round of transport. This implies that the amount of available receptor could be a rate-limiting factor determining both the rate and amount of IgA transported per cell and therefore determining the total IgA output into the lumen or, in case of the mammary gland, into the milk. In order to test this hypothesis, we set up an in vivo model system. We generated transgenic mice over-expressing the murine pIgR gene under lactogenic control, by using a milk gene promoter, rather than under immunological control. Mice over-expressing the pIgR protein, in mammary gland epithelial cells, from 60- up to 270-fold above normal pIgR protein levels showed total IgA levels in the milk to be 1.5-2-fold higher, respectively, compared with the IgA levels in the milk of non-transgenic mice. This indicates that the amount of pIgR produced is indeed a limiting factor in the transport of dIgA into the milk under normal non-inflammatory circumstances.
Figures
Similar articles
-
Over-expression of the murine polymeric immunoglobulin receptor gene in the mammary gland of transgenic mice.Transgenic Res. 1999 Apr;8(2):125-35. doi: 10.1023/a:1008981312682. Transgenic Res. 1999. PMID: 10481312
-
Lymphocyte homing and Ig secretion in the murine mammary gland.Scand J Immunol. 2001 Sep;54(3):292-300. doi: 10.1046/j.1365-3083.2001.00933.x. Scand J Immunol. 2001. PMID: 11555393
-
Generation of polymeric immunoglobulin receptor-deficient mouse with marked reduction of secretory IgA.J Immunol. 1999 Nov 15;163(10):5367-73. J Immunol. 1999. PMID: 10553061
-
Polymeric immunoglobulin receptor.J Oral Sci. 2011 Jun;53(2):147-56. doi: 10.2334/josnusd.53.147. J Oral Sci. 2011. PMID: 21712618 Review.
-
Novel functions of the polymeric Ig receptor: well beyond transport of immunoglobulins.Trends Immunol. 2003 Feb;24(2):55-8. doi: 10.1016/s1471-4906(02)00031-5. Trends Immunol. 2003. PMID: 12547499 Review.
Cited by
-
Expression and Function of Mammary Epithelial Cell-Derived Immunoglobulins.Adv Exp Med Biol. 2024;1445:169-177. doi: 10.1007/978-981-97-0511-5_14. Adv Exp Med Biol. 2024. PMID: 38967759 Review.
-
Mammary gland immunity and mastitis susceptibility.J Mammary Gland Biol Neoplasia. 2002 Apr;7(2):135-46. doi: 10.1023/a:1020347818725. J Mammary Gland Biol Neoplasia. 2002. PMID: 12463736 Review.
-
Unravelling the Proteomic Profiles of Bovine Colostrum and Mature Milk Derived from the First and Second Lactations.Foods. 2023 Nov 7;12(22):4056. doi: 10.3390/foods12224056. Foods. 2023. PMID: 38002115 Free PMC article.
-
Immune components of colostrum and milk--a historical perspective.J Mammary Gland Biol Neoplasia. 2007 Dec;12(4):237-47. doi: 10.1007/s10911-007-9051-7. Epub 2007 Nov 9. J Mammary Gland Biol Neoplasia. 2007. PMID: 17992474 Review.
-
The prospects of modifying the antimicrobial properties of milk.Biotechnol Adv. 2001 Jul;19(4):299-316. doi: 10.1016/s0734-9750(01)00069-6. Biotechnol Adv. 2001. PMID: 14538078 Free PMC article.
References
-
- Kraehenbuhl J-P, Neutra MR. Molecular and cellular basis of immune protection of mucosal surfaces. Phys Rev. 1992;72:853–79. - PubMed
-
- Mostov KE. Transepithelial transport of immunoglobulins. Annu Rev Immunol. 1994;12:63–84. - PubMed
-
- Mostov KE, Friedlander M, Blobel G. The receptor for transepithelial transport of IgA and IgM contains multiple immunoglobulin-like domains. Nature. 1984;308:37–43. - PubMed
-
- Eiffert H, Quentin E, Wiederhold M, Hillemeir S, Decker J, Weber M, Hilschmann N. Determination of the molecular structure of the human free secretory component. Biol Chem Hoppe-Seyler. 1991;372:119–28. - PubMed
-
- Okamoto CT, Shia S-P, Bird C, Mostov KE, Roth MG. The cytoplasmic domain of the polymeric immunoglobulin receptor contains two internalization signals that are distinct from its basolateral sorting signal. J Biol Chem. 1992;267:9925–32. - PubMed
MeSH terms
Substances
LinkOut - more resources
Full Text Sources
Other Literature Sources
Miscellaneous
