. 2000 Oct 2;19(19):5041-50.
doi: 10.1038/sj.emboj.7593319.

Differential electron flow around photosystem I by two C(4)-photosynthetic-cell-specific ferredoxins

Affiliations

Differential electron flow around photosystem I by two C(4)-photosynthetic-cell-specific ferredoxins

Y Kimata-Ariga et al. EMBO J. .

Abstract

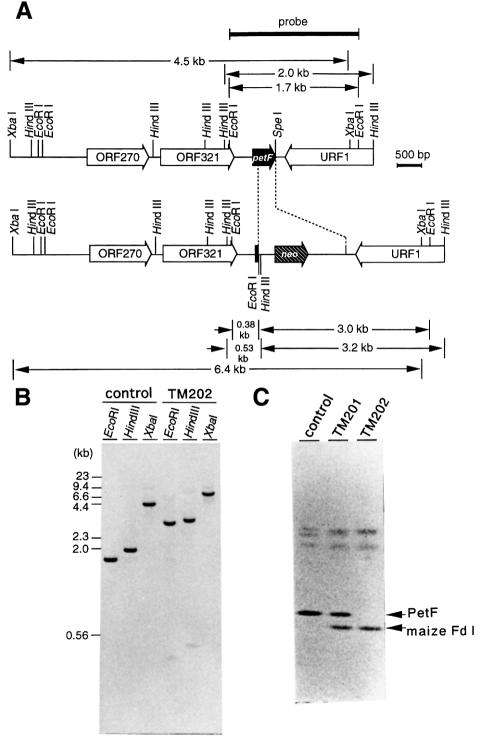
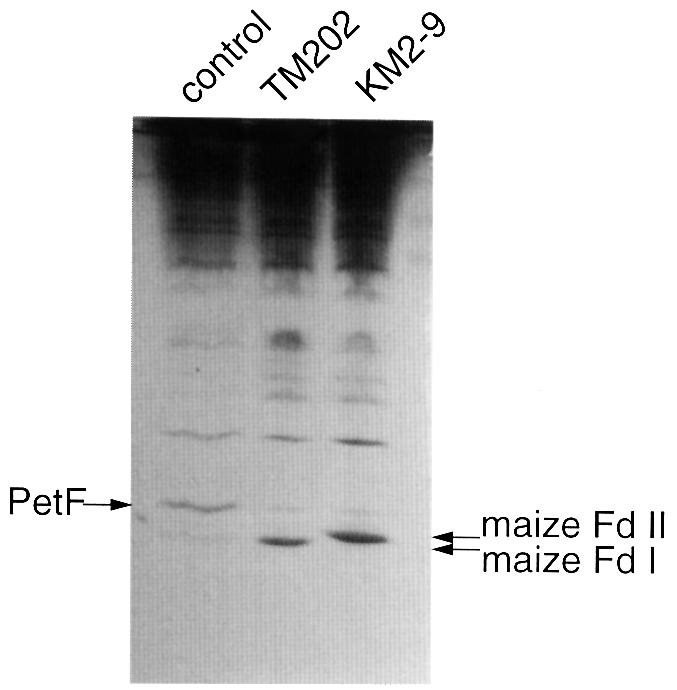
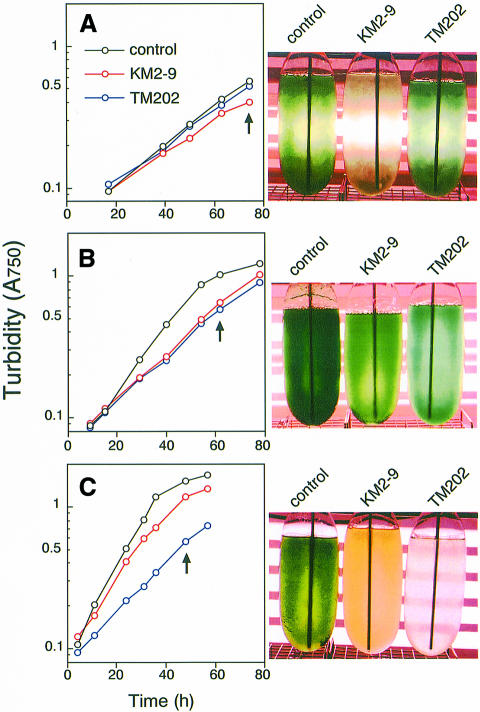
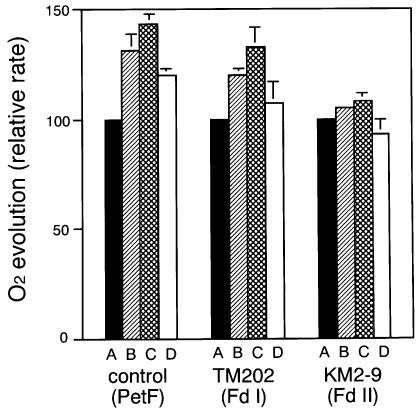
In the C(4) plant maize (Zea mays L.), two ferredoxin isoproteins, Fd I and Fd II, are expressed specifically in mesophyll and bundle-sheath cells, respectively. cDNAs for these ferredoxins were introduced separately into the cyanobacterium Plectonema boryanum with a disrupted endogenous ferredoxin gene, yielding TM202 and KM2-9 strains expressing Fd I and Fd II. The growth of TM202 was retarded under high light (130 micromol/m(2)/s), whereas KM2-9 grew at a normal rate but exhibited a nitrogen-deficient phenotype. Measurement of photosynthetic O(2) evolution revealed that the reducing power was not efficiently partitioned into nitrogen assimilation in KM2-9. After starvation of the cells in darkness, the P700 oxidation level under far-red illumination increased significantly in TM202. However, it remained low in KM2-9, indicating an active cyclic electron flow. In accordance with this, the cellular ratio of ATP/ADP increased and that of NADPH/NADP(+) decreased in KM2-9 as compared with TM202. These results demonstrated that the two cell type-specific ferredoxins differentially modulate electron flow around photosystem I.


Figures

None
Fig. 1. Construction of a plasmid for the expression of maize Fd I in P.boryanum. A shuttle vector, pSVM30, between P.boryanum and E.coli, a derivative of pPBH201 with the lacIq gene, was used for the construction. A segment containing the trp promoter and the Fd coding region of pTMmFD1, which expresses the mature part of maize Fd I in E.coli (Matsumura et al., 1999), was excised at SspI sites and inserted into an end-filled PstI site of pSVM30 under the control of the lacIqgene, yielding pSVMmFD1.
None
Fig. 2. (A) Physical map of the 4.8 kb genomic DNA fragment containing the petF gene. Two open reading frames, ORF270 and ORF321, and one partial reading frame, URF1, other than that of the petF gene are contained in a 4762 bp DNA fragment cloned from the P.boryanum genome. These sequence data have been submitted to the DDBJ/EMBL/GenBank database under Accession No. AB017194. The position and direction of the neo gene introduced for the targeted mutagenesis are shown in the lower map. The position of a probe used for Southern analysis is indicated by a heavy bar. (B) Southern analysis of the genome of the petF-disrupted mutant expressing maize Fd I. Genomic DNAs (0.4 µg of each) from the original strain (control) and petF-disrupted mutant expressing maize Fd I (TM202) were digested with the restriction enzymes indicated, size fractionated and probed with a 1.7 kb EcoRI fragment as indicated in (A). Sizes of marker DNA fragments are shown on the left. (C) Western analysis of maize Fd I and the petF gene product in P.boryanum cells. Cells of the original strain (control), the transformant expressing maize Fd I (TM201) and the petF-disrupted mutant expressing maize Fd I (TM202) were grown photomixotrophically in the presence of 30 mM glucose and 200 µM IPTG. Total crude extracts of the cells (corresponding to 30 µg of protein) were loaded on the gel and immunolabeled with anti-maize Fd I antibodies that also reacted with the petF gene product.
None
Fig. 3. Effects of IPTG concentration on the growth of petF-disrupted P.boryanum cells expressing maize Fd I (TM202) and Fd II (KM2-9). Cells of TM202 and KM2-9 strains were grown photoautotrophically with different concentrations of IPTG under the light intensities and growth periods indicated.
None
Fig. 4. Expression of maize Fd I and Fd II in petF-disrupted P.boryanum cells. Cells of the original strain (control) and the petF-disrupted mutants expressing maize Fd I (TM202) and Fd II (KM2-9) were grown photoautotrophically in the presence of 200 µM IPTG under a light intensity of 50 µmol/m2/s. Total crude extracts of the cells (corresponding to 10 µg of chlorophyll) were subjected to non-denaturing PAGE (Kimata and Hase, 1989) and stained with Coomassie Blue. The amount of protein loaded on the gel was 23, 23 and 35 µg for the control, TM202 and KM2-9, respectively. The faint bands detected at the same migration as the petF gene product in the TM202 and KM2-9 lanes are not the remaining petF gene product, but other proteins, as confirmed by immunodetection with anti-Fd antibodies (data not shown).
None
Fig. 5. Growth curves and tonalities of petF-disrupted P.boryanum cells expressing maize Fd I (TM202) and Fd II (KM2-9) and the original strain (control). (A) Cells were grown photoautotrophically in the presence of 200 µM IPTG under low light (25 µmol/m2/s), (B) under medium light (50 µmol/m2/s) and (C) under high light (130 µmol/m2/s). Growth was monitored by absorption at 750 nm. Culture bottles of the three strains were photographed at the growth stages indicated by an arrow in each panel.
None
Fig. 6. The rate of O2 evolution dependent on CO2 only, and on both CO2 and NO3 as a function of light intensity in the original strain (control) and petF-disrupted P.boryanum cells expressing maize Fd I (TM202) and Fd II (KM2-9). Cells were grown photoautotrophically in the presence of 200 µM IPTG under medium light (50 µmol/m2/s), suspended in nitrate-free BG11 medium, and after addition of 10 mM NaHCO3 only (closed symbols) or both 10 mM NaHCO3 and 1 mM NaNO3 (open symbols) to the medium, O2 evolution was measured under increasing light intensities from 20 to 120 µmol/m2/s.
None
Fig. 7. Relative rate of O2 evolution dependent on CO2 only, and on both CO2 and an inorganic nitrogen compound (NO3, NO2 or NH4+) in the original strain (control) and petF-disrupted P.boryanum cells expressing maize Fd I (TM202) and Fd II (KM2-9). Cells were grown photoautotrophically in the presence of 200 µM IPTG under medium light (50 µmol/m2/s), suspended in nitrate-free BG11 medium and, after addition of 10 mM NaHCO3, O2 evolution at 120 µmol/m2/s light intensity was measured in the presence of no additional reagents (A), 1 mM NaNO3 (B), 1 mM NaNO2 (C) or 1 mM NH4Cl (D). Relative rates, compared with that of CO2-dependent O2 evolution in each strain (normalized as 100), are expressed as the mean ± SD of three independent determinations.
None
Fig. 8. Oxidation and reduction kinetics of P700 induced by FR light (>710 nm) and 50 ms saturating MT light in the original strain (control) and petF-disrupted P.boryanum cells expressing maize Fd I (TM202) and Fd II (KM2-9). (A) Cells were grown photo autotrophically in the presence of 200 µM IPTG under medium light (50 µmol/m2/s). (B) Cells were grown photoautotrophically in the presence of 200 µM IPTG under medium light and then transferred to the dark for 72 h. All measurements were performed using the cells that were suspended in BG11 at 100 µg Chl/ml. The intensity of the FR light irradiated was 9 W/m2 except for the measurement at the bottom of (B), which was performed at 11 W/m2. Where indicated, glucose at 30 mM was added to the suspensions of cells in the dark, 2 min before the measurements. The respiratory activity of the cells is denoted in parentheses under each measurement, which was expressed as pmoles of O2 consumed per milligram of chlorophyll per minute.

References

    1. Bendall D.S. and Manasse,R.S. (1995) Cyclic photophosphorylation and electron transport. Biochim. Biophys. Acta, 1229, 23–38.
    1. Berger S., Ellersiek,U., Westhoff,P. and Steinmüller,K. (1993) Studies on the expression of NDH-H, a subunit of the HAD(P)H-plastoquinone-oxidoreductase of higher-plant chloroplasts. Planta, 190, 25–31.
    1. Burrows P.A., Sazanov,L.A., Svab,Z., Maliga,P. and Nixon,P.J. (1998) Identification of a functional respiratory complex in chloroplasts through analysis of tobacco mutants containing disrupted plastid ndh genes. EMBO J., 17, 868–876. - PMC - PubMed
    1. Canaani O. (1990) The role of cyclic electron flow around photosystem I and excitation energy distribution between the photosystems upon acclimation to high ionic strength in Dunaliella.Photochem. Photobiol., 52, 591–599.
    1. Cassing A., Boehme,H. and Schrautemeier,B. (1995) Nucleotide sequence, promoter structure, and expression of the petF1 gene (accession No. U33848) encoding the [2Fe–2S] Fd I from the nitrogen-fixing nonheterocystous cyanobacterium Plectonema boryanum PCC 73110. Plant Physiol., 109, 1499.

Publication types

MeSH terms