. 2000 Oct 2;19(19):5092-104.
doi: 10.1093/emboj/19.19.5092.

Decreased UDP-GlcNAc levels abrogate proliferation control in EMeg32-deficient cells

Affiliations

Decreased UDP-GlcNAc levels abrogate proliferation control in EMeg32-deficient cells

G Boehmelt et al. EMBO J. .

Abstract

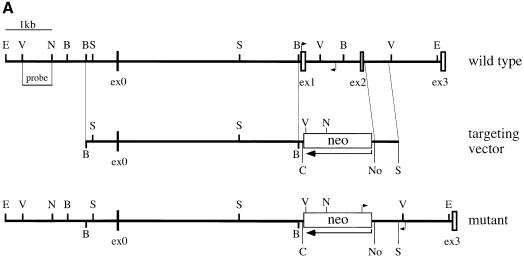
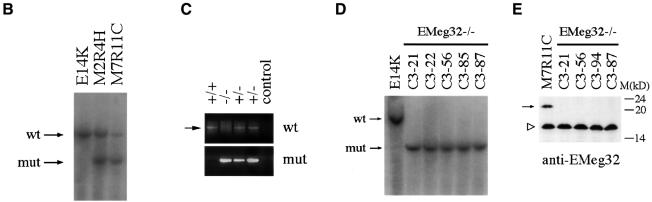
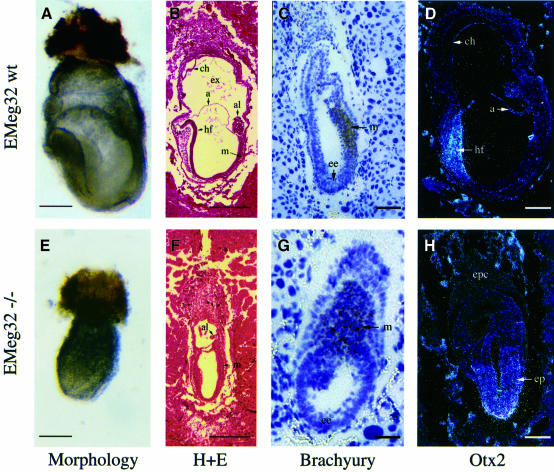
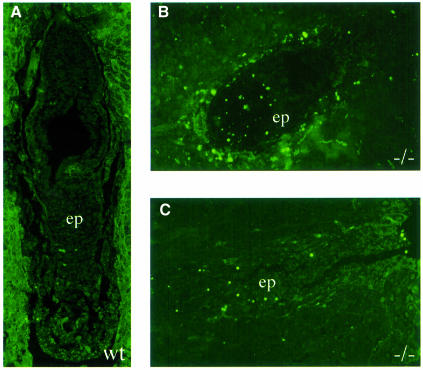
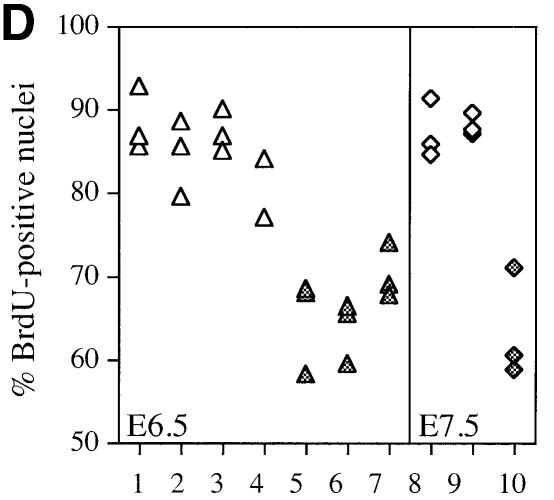
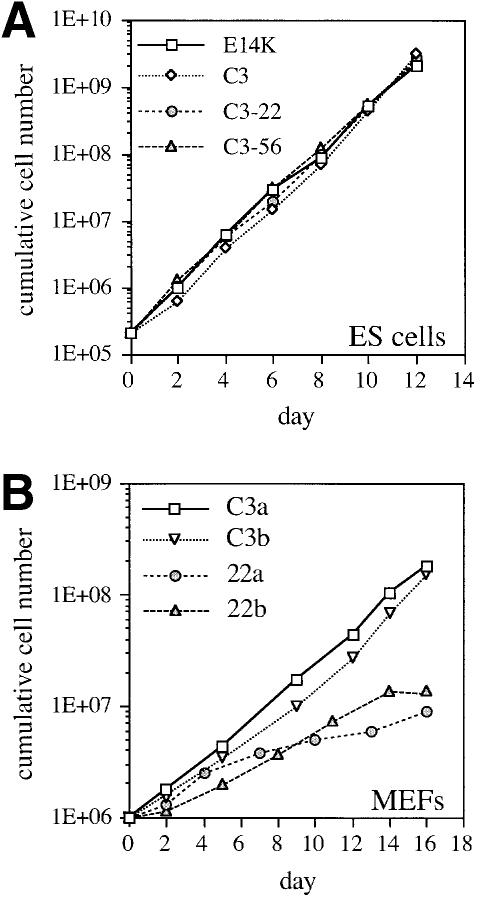
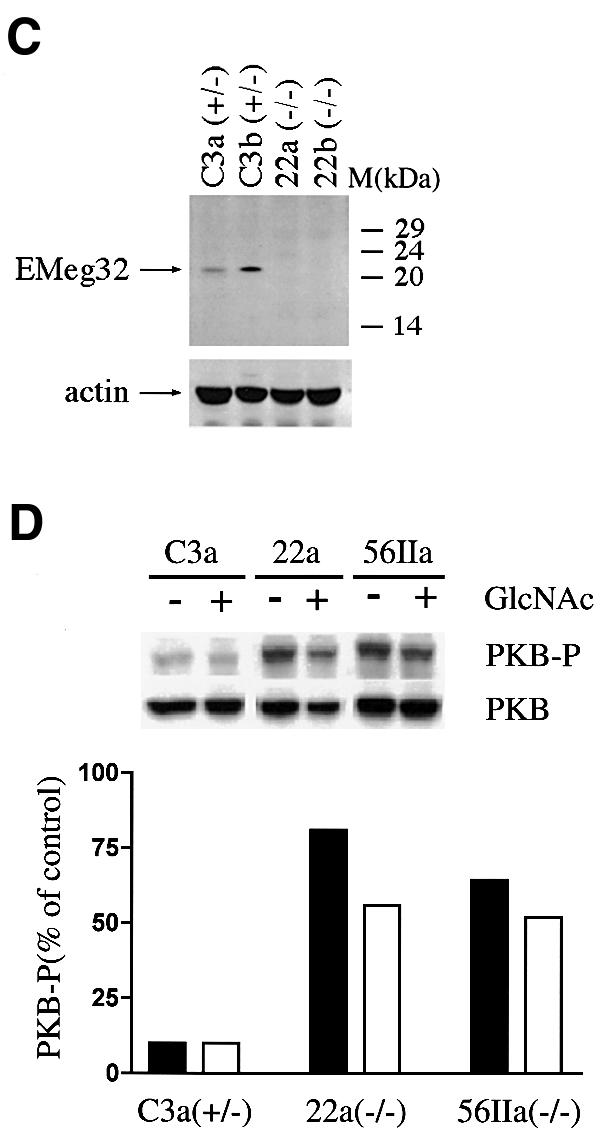
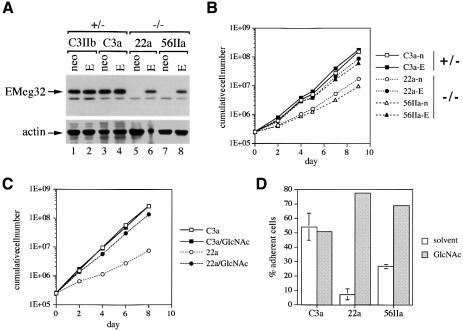
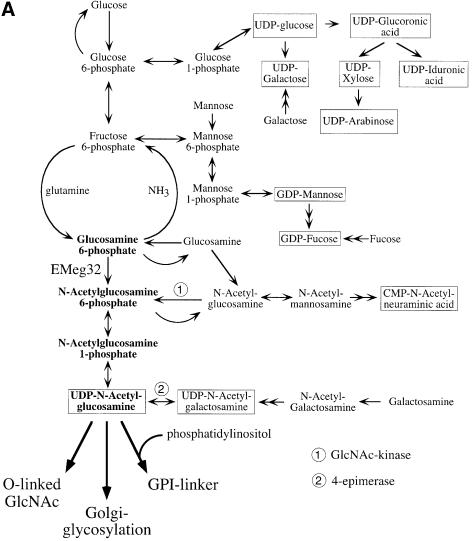
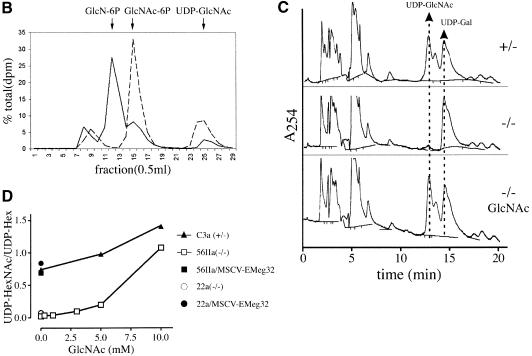
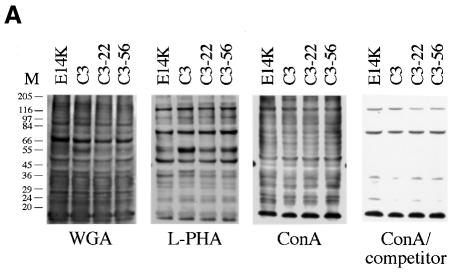
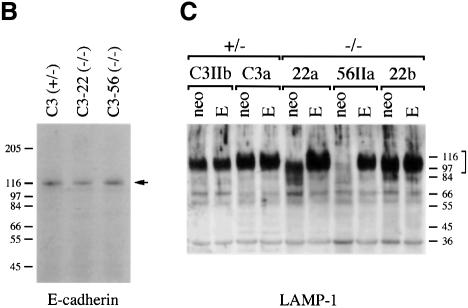
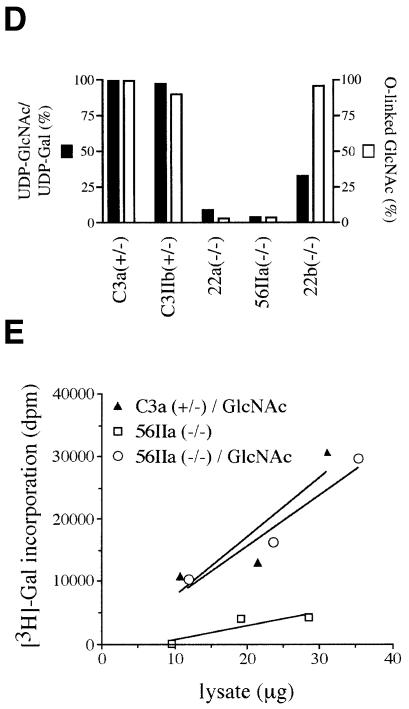
The hexosamine pathway provides UDP-N:-acetylhexosamine donor substrates used in cytosolic and Golgi-mediated glycosylation of proteins and for formation of glycosylphosphatidylinositol (GPI) anchors, which tether proteins to the outer plasma membrane. We have recently identified the murine glucosamine-6-phosphate (GlcN6P) acetyltransferase, EMeg32, as a developmentally regulated enzyme on the route to UDP-N:-acetylglucosamine (UDP-GlcNAc). Here we describe embryos and cells that have the EMeg32 gene inactivated by homologous recombination. Homozygous mutant embryos die at around embryonic day (E) 7.5 with a general proliferative delay of development. In vitro differentiated EMeg32(-/-) ES cells show reduced proliferation. Mouse embryonic fibroblasts (MEFs) deficient for EMeg32 exhibit defects in proliferation and adhesiveness, which could be complemented by stable re-expression of EMeg32 or by nutritional restoration of intracellular UDP-GlcNAc levels. Reduced UDP-GlcNAc levels predominantly translated into decreased O-GlcNAc modifications of cytosolic and nuclear proteins. Interestingly, growth-impaired EMeg32(-/-) MEFs withstand a number of apoptotic stimuli and express activated PKB/AKT. Thus, EMeg32-dependent UDP-GlcNAc levels influence cell cycle progression and susceptibility to apoptotic stimuli.


Figures

None
Fig. 1. Gene targeting of the murine EMeg32 locus. (A) Schematic representation of the targeting vector and mouse EMeg32 wild-type and mutant loci. Open boxes represent exons (ex). The large arrow indicates transcriptional direction of the neomycin resistance cassette (neo). Small arrows mark positions of PCR primers used to identify wild-type and mutant alleles. Bar, 1 kb of sequence; B, Bst1107I; C, ClaI; E, EcoRI; N, NcoI; No, NotI; S, SacI; V, EcoRV. (B) Southern blot analysis of ES cell genomic DNA from wild-type (E14K) and +/– (M2R4H, M7R11C) cell lines after digestion with EcoRI plus ClaI. The 5′ flanking probe [EcoRV–NcoI fragment shown in (A)] was used. DNA fragments derived from the 9.4 kb wild-type (wt) and 6.4 kb mutant (mut) allele are indicated. (C) Lysates from E7.5 embryos were analysed by PCR using the primers specific for the wild-type (wt, 750 bp fragment, arrow) or mutant (mut, 880 bp fragment) allele, respectively. EMeg32 genotypes (+/+, +/–, –/–) are indicated. A background smear in the wild-type PCR reaction is unspecific. Control, no DNA added. (D) Southern blot analysis of EMeg32 ES cell clones surviving increased G418 concentration. Procedure and labeling as described in (B). (E) Western blot analysis demonstrating loss of EMeg32 protein (arrow) in four –/– ES clones (C3-21, C3-56, C3-94 and C3-87). An unspecific band (open triangle) usually detected by EMeg32 antibody #2087 and the positions of protein standards (M) are indicated. Control, heterozygous M7R11C ES cells.
None
Fig. 2. Impaired development of mutant EMeg32 embryos. Morphology of wild-type (A) or mutant (E) embryos at E7.5. Bars, 280 µm. Hematoxylin and eosin (H+E) staining of E7.5 wild-type embryo (B) showing organized development of mesoderm (m), headfold (hf) structures, allantois (al), amnion (a), exocoel (ex) and chorion (ch). (F) E7.5 mutant embryos resemble wild-type embryos developmentally delayed by 1.0–1.5 days (see text for details). Bars, 450 µm. In situ hybridization on sections of wild type (C and D) or mutant (G and H) EMeg32 embryos using a Brachyury (C, G) or an Otx2-specific (D, H) antisense probe, respectively. Embryos were at E6.5 (C, G) or E7.5 (D, H). Abbreviations are as in (B); ep, epiblast; ee, embryonic ectoderm. Bars, 70 µm (G), 140 µm (C), 210 µm (D, H).
None
Fig. 3. Increased apoptosis and decreased proliferation in EMeg32 mutant embryos. (AC) TUNEL staining on sections of wild-type (A) and mutant (B, C) EMeg32 embryos at E6.5. Note the increased number of apoptotic cells (bright green) in the epiblast (ep) of mutant embryos. (D) BrdU incorporation into wild-type (open symbols) or mutant (filled symbols) EMeg32 embryos at E6.5 (triangles) or E7.5 (diamonds), respectively. The percentage of BrdU-positive nuclei was determined in fields of at least 150 or 230 cells for E6.5 or E7.5 embryos, respectively. Only embryonic tissue was evaluated.
None
Fig. 4. Growth properties of EMeg32-deficient ES cells and MEFs. (A) Cumulative cell numbers from ES cells grown in the presence of LIF on gelatinized dishes. E14K (wild-type), square; C3 (+/–), diamond; C3-22 (–/–), circle; C3-56 (–/–), triangle. (B) Cumulative cell numbers of established MEF lines early after crisis. C3a (+/–), square; C3b (+/–), open triangle; 22a (–/–), circle; 22b (–/–), closed triangle. Average values of duplicate samples were plotted in (A) and (B). (C) Western blot demonstrating loss of EMeg32 protein (EMeg32) in –/– MEF lines (22a and 22b). +/– MEF lines (C3a and C3b) were loaded as controls. Anti-actin immunoblotting (actin) was used as loading control. (D) Constitutively activated PKB/AKT in EMeg32–/– cells. Western blot analysis of lysates from EMeg32–/– MEFs and heterozygous controls in the presence (+) or absence (–) of 10 mM GlcNAc. Antibodies used were anti-phospho-Ser473-PKB (PKB-P), anti-PKB raised against the unphosphorylated peptide (PKB) and anti-phospho-MAP kinase (control, not shown). Bands were quantified using a densitometer. Levels of phospho-PKB were plotted as a percentage of control. Black or white bars represent absence or presence of 10 mM GlcNAc, respectively.
None
Fig. 5. Restoration of EMeg32 function rescues the defects. (A) Western blots of +/– (C3IIb, C3a) or –/– (22a, 56IIa) MEF lines stably expressing MSCV-neo (neo) or MSCV-EMeg32 retroviruses (E) were incubated with anti-EMeg32 #2087 or anti-actin antibodies. Arrows indicate the respective specific signals. (B) Cumulative cell numbers were determined as in Figure 4 of MEF lines stably expressing MSCV-neo (open symbols) or MSCV-EMeg32 (filled symbols). Genotypes of parental cells are indicated on the right. (C) Cumulative cell numbers of C3a (+/–) and 22a (–/–) MEFs in the absence or presence of 10 mM GlcNAc (/GlcNAc) were determined as in Figure 4. (D) MEFs (250 000) were plated for 20 min and the percentage of adherent cells determined. Error bars, SEM. Samples were preincubated for 48 h with (gray) or without (white) 10 mM GlcNAc. C3a (+/–), 22a (–/–) and 56IIa (–/–) MEFs were analyzed.
None
Fig. 6. Decrease and replenishment of UDP-GlcNAc levels in EMeg32–/– cells. (A) Scheme depicting the synthesis of nucleotide sugars (boxed) with the pathway relevant for EMeg32 activity in bold. Main routes for further use of UDP-GlcNAc are indicated. Doubleheaded arrows represent several enzymatic steps not depicted in detail. Adapted from Schachter (1978). (B) EMeg32+/– (dashed line) or EMeg32–/– (solid line) EBs were labeled for 90 min with [3H]GlcN and analyzed by HPLC. Positions of GlcN-6P, GlcNAc-6P and UDP-GlcNAc standards are marked by arrows. (C) HPLC elution profile at A254 nm. Cells used were C3a+/–, 56IIa–/– or 56IIa–/– MEFs supplemented with 10 mM GlcNAc for 24 h (–/– GlcNAc). Arrows indicate elution positions of UDP-GlcNAc and UDP-Gal; the peak between is UDP-GalNAc. (D) Titration of GlcNAc into the culture medium for 24 h and determination of UDP-HexNAc:UDP-Hex ratio by HPLC at A254 nm. EMeg32–/– MEFs (56IIa, open square; 22a, open circle); +/– MEFs (C3a, filled triangle). 56IIa or 22a MEFs re-expressing EMeg32 (filled square or circle, respectively) were also analyzed. The UDP-Hex levels remained unchanged.
None
Fig. 7. Differential impairment of downstream routes of UDP-GlcNAc in EMeg32–/– cells. (A) Normalized lysates of 8 day differentiated EMeg32+/+ (E14K), EMeg32+/– (C3) and EMeg32–/– (C3-22, C3-56) EBs were blotted and analyzed using biotinylated lectins WGA, l-PHA or ConA in the presence (ConA/competitor) or absence (ConA) of 1 M 1-α-methyl-d-glucose. (B) Western blot of EB lysates [genotypes as in (A)] analyzed for E-cadherin expression (arrow). (C) LAMP-1 expression and glycosylation in EMeg32+/– and EMeg32–/– MEFs expressing MSCV-neo (neo) or MSCV-EMeg32 (E). LAMP-1 forms are indicated by a bracket; protein standards are in kDa at the right. (D) β-1,4-galactosyltransferase assay (open bars) on EMeg32+/– (C3a, C3IIb) and EMeg32–/– (22a, 56IIa, 22b) MEFs in relation to their UDP-GlcNAc:UDP-Gal ratio (filled bars) done by duplicate HPLC analysis as described in Figure 6C. (E) β-1,4-galactosyltransferase-mediated [3H]galactose labeling of cytosolic extracts prepared from C3a EMeg32+/– (filled triangle) or 56IIa EMeg32–/– MEFs grown in the absence (open square) or presence (open circle) of 10 mM GlcNAc. (FH) GPI-linker formation as detected by proaerolysin sandwich-western of lysates from EBs (F), MEFs (G) and MEFs expressing MSCV-neo or MSCV-EMeg32 (G).
None
Fig. 8. EMeg32-dependent defect in actin depolymerization. (AH) MEFs were incubated with 500 nM latrunculin A (B, D, F and H) or solvent (A, C, E and G) for 30 min prior to fixing and phalloidin–FITC and DAPI staining to visualize actin and nuclei, respectively. Cell types analyzed were (A, B) C3a/MSCV-neo, (C, D) C3a/MSCV-EMeg32, (E, F) 56IIa/MSCV-neo, (G, H) 56IIa/MSCV-EMeg32 MEFs. Genotypes are indicated.

References

    1. Acharya U., Jacobs,R., Peters,J.M., Watson,N., Farquhar,M.G. and Malhotra,V. (1995) The formation of Golgi stacks from vesiculated Golgi membranes requires two distinct fusion events. Cell, 82, 895–904. - PubMed
    1. Asano M., Furukawa,K., Kido,M., Matsumoto,S., Umesaki,Y., Kochibe,N. and Iwakura,Y. (1997) Growth retardation and early death of β-1,4-galactosyltransferase knockout mice with augmented proliferation and abnormal differentiation of epithelial cells. EMBO J., 16, 1850–1857. - PMC - PubMed
    1. Ayscough K. (1998) Use of latrunculin-A, an actin monomer-binding drug. Methods Enzymol., 298, 18–25. - PubMed
    1. Bamburg J.R., McGough,A. and Ono,S. (1999) Putting a new twist on actin: ADF/cofilins modulate actin dynamics. Trends Cell Biol., 9, 364–370. - PubMed
    1. Boehmelt G., Fialka,I., Brothers,G., McGinley,M.D., Patterson,S.D., Mo,R., Hui,C.C., Huber,L.A., Mak,T.W. and Iscove,N.N. (2000) Cloning and characterization of the murine glucosamine-6-phosphate acetyltransferase EMeg32. J. Biol. Chem., 275, 12821–12832. - PubMed

Publication types

MeSH terms

Substances