. 2000 Oct;38(10):3780-4.
doi: 10.1128/JCM.38.10.3780-3784.2000.

Bacillus anthracis diversity in Kruger National Park

Affiliations

Bacillus anthracis diversity in Kruger National Park

K L Smith et al. J Clin Microbiol. 2000 Oct.

Abstract

The Kruger National Park (KNP), South Africa, has a recorded history of periodic anthrax epidemics causing widespread disease among wild animals. Bacillus anthracis is the causative agent of anthrax, a disease primarily affecting ungulate herbivores. Worldwide there is little diversity among B. anthracis isolates, but examination of variable-number tandem repeat (VNTR) loci has identified six major clones, with the most dissimilar types split into the A and B branches. Both the A and B types are found in southern Africa, giving this region the greatest genetic diversity of B. anthracis worldwide. Consequently, southern Africa has been hypothesized to be the geographic origin of B. anthracis. In this study, we identify the genotypic types of 98 KNP B. anthracis isolates using multiple-locus VNTR analysis. Two major types are evident, the A branch and the B branch. The spatial and temporal distribution of the different genotypes indicates that anthrax epidemic foci are independent, though correlated through environmental cues. Kruger B isolates were found on significantly higher-calcium and higher-pH soils than were Kruger type A. This relationship between genotype and soil chemistry may be due to adaptive differences among divergent anthrax strains. While this association may be simply fortuitous, adaptation of A types to diverse environmental conditions is consistent with their greater geographic dispersal and genetic dissimilarity.


Figures

FIG. 1
FIG. 1
Genetic relationships among KNP B. anthracis isolates. Eight VNTR marker loci (9) were used to estimate genetic relationships among the 98 B. anthracis isolates in the study. UPGMA cluster analysis generated a dendrogram to graphically represent dissimilarity among the unique types observed. On average, the A and B isolates have different alleles at two-thirds of the eight loci. The allele size at each VNTR locus is shown along with the number of isolates (N) in each genotypic group (G). Genotype number and VNTR marker alleles are consistent with a previous report (9). The major diversity group (9) represented in each of the branches is shown in parentheses beside the branch designation. The D calculated for each of the eight markers is listed below the dendrogram.
FIG. 2
FIG. 2
Isolate locations and Bernoulli regression clusters. (I) This map shows the individual isolate locations within the KNP. At the scale presented, many isolate locations overlap and may appear less dense than the actual total. (II) This map shows the geographic areas included in the Bernoulli regression for time-space cluster detection. The secondary time-space cluster for Kruger A isolates is in the middle of the park (the primary cluster included the entire park), and the primary time-space cluster for Kruger B isolates includes all of the north of the park.
FIG. 3
FIG. 3
Isolate-year relationships. This histogram shows the number of isolates (in parentheses) and branch affiliation by year of field isolation.
FIG. 4
FIG. 4
Kernel density probability of Kruger isolates. (I) This map shows the kernel density probabilities estimated for the Kruger A strains included in this study. Representation of minor strain subtypes (genotypes [G] 39 and 45) is indicated. (II) This map shows the kernel density probabilities for the Kruger B strains. The actual number of samples for each area (N) is also shown for both maps.
FIG. 5
FIG. 5
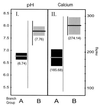
Genotype relationships with soil pH and calcium values. (I) Mean soil pH in parentheses (95% confidence interval and range of values for Kruger A and B genotype groups at the field isolate sites). (II) Mean soil calcium content (95% confidence interval and range of values for Kruger A and B genotype groups). In a nonparametric analysis of variance, the two strain type groups were statistically significantly different with respect to both soil pH (Z = 4.870 and P < 0.0001) and soil calcium (Z = 3.999 and P < 0.0001).

Similar articles

Cited by

References

    1. De Vos V. Anthrax. In: Coetzer J A W, Thomson G R, Tustin R C, editors. Infectious diseases of livestock with special reference to Southern Africa. Vol. 2. Oxford, United Kingdom: Oxford University Press; 1994. pp. 1262–1289.
    1. De Vos V. The ecology of anthrax in the Kruger National Park. Salisbury Med Bull. 1990;68(Spec. Suppl.):19–23.
    1. De Vos V, Bryden H B. Anthrax in the Kruger National Park: temporal and spatial patterns of disease occurrence. Salisbury Med Bull. 1996;87(Spec. Suppl.):26–30.
    1. Dragon D C, Rennie R P. The ecology of anthrax spores: tough but not invincible. Can Vet J. 1995;36:295–301. - PMC - PubMed
    1. Farrar W E. Anthrax: from Mesopotamia to molecular biology. Pharos. 1995;58:35–38. - PubMed

Publication types

LinkOut - more resources