

Lineage-specific loss and divergence of functionally linked genes in eukaryotes
- PMID: 11016957
- PMCID: PMC17198
- DOI: 10.1073/pnas.200346997
Lineage-specific loss and divergence of functionally linked genes in eukaryotes
Abstract
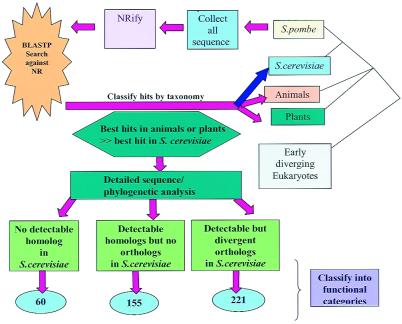
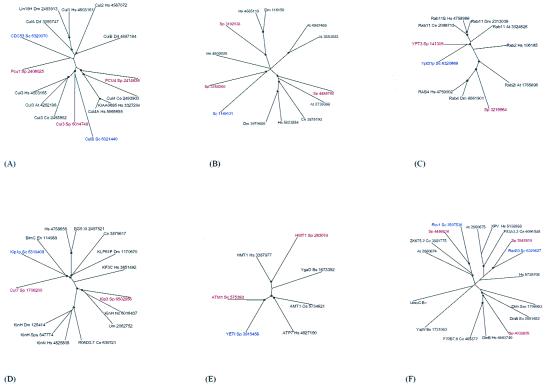
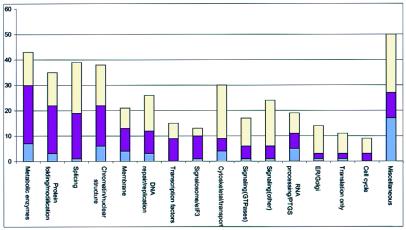
By comparing 4,344 protein sequences from fission yeast Schizosaccharomyces pombe with all available eukaryotic sequences, we identified those genes that are conserved in S. pombe and nonfungal eukaryotes but are missing or highly diverged in the baker's yeast Saccharomyces cerevisiae. Since the radiation from the common ancestor with S. pombe, S. cerevisiae appears to have lost about 300 genes, and about 300 more genes have diverged by far beyond expectation. The most notable feature of the set of genes lost in S. cerevisiae is the coelimination of functionally connected groups of proteins, such as the signalosome and the spliceosome components. We predict similar coelimination of the components of the posttranscriptional gene-silencing system that includes the recently identified RNA-dependent RNA polymerase. Because one of the functions of posttranscriptional silencing appears to be "taming" of retrotransposons, the loss of this system in yeast could have triggered massive retrotransposition, resulting in elimination of introns and subsequent loss of spliceosome components that become dispensable. As the genome database grows, systematic analysis of coordinated gene loss may become a general approach for predicting new components of functional systems or even defining previously unknown functional complexes.
Figures

References
-
- Koonin E V, Mushegian A R, Galperin M Y, Walker D R. Mol Microbiol. 1997;25:619–637. - PubMed
-
- Aravind L, Tatusov R L, Wolf Y I, Walker D R, Koonin E V. Trends Genet. 1998;14:442–444. - PubMed
-
- Andersson J O, Andersson S G. Curr Opin Genet Dev. 1999;9:664–671. - PubMed
-
- Nelson K E, Clayton R A, Gill S R, Gwinn M L, Dodson R J, Haft D H, Hickey E K, Peterson J D, Nelson W C, Ketchum K A, et al. Nature (London) 1999;399:323–329. - PubMed
-
- Kupfer D M, Reece C A, Clifton S W, Roe B A, Prade R A. Fungal Genet Biol. 1997;21:364–372. - PubMed
MeSH terms
LinkOut - more resources
Full Text Sources
Molecular Biology Databases
Research Materials
