

doi: 10.1073/pnas.210171597.
Generation of oscillations by the p53-Mdm2 feedback loop: a theoretical and experimental study
Affiliations
- PMID: 11016968
- PMCID: PMC17186
- DOI: 10.1073/pnas.210171597
Item in Clipboard
Generation of oscillations by the p53-Mdm2 feedback loop: a theoretical and experimental study
Proc Natl Acad Sci U S A.
.
Abstract
The intracellular activity of the p53 tumor suppressor protein is regulated through a feedback loop involving its transcriptional target, mdm2. We present a simple mathematical model suggesting that, under certain circumstances, oscillations in p53 and Mdm2 protein levels can emerge in response to a stress signal. A delay in p53-dependent induction of Mdm2 is predicted to be required, albeit not sufficient, for this oscillatory behavior. In line with the predictions of the model, oscillations of both p53 and Mdm2 indeed occur on exposure of various cell types to ionizing radiation. Such oscillations may allow cells to repair their DNA without risking the irreversible consequences of continuous excessive p53 activation.
Figures
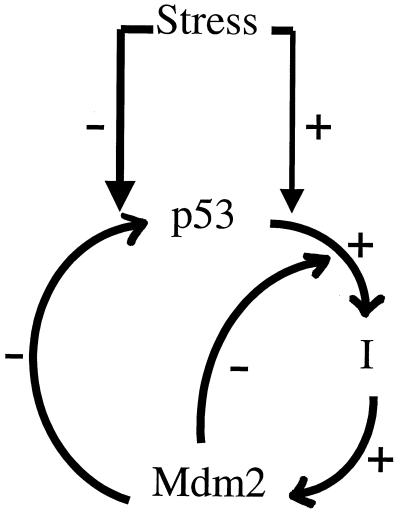
A schematic illustration of the controlling interactions in the model.
p53 induces Mdm2 via an intermediary I, postulated to
introduce the idea of delay between p53 activation and p53-dependent
induction of Mdm2. Mdm2, in turn, negatively affects (i)
p53 levels (right arrow) and (ii) p53-dependent Mdm2
induction (left arrow). Stress conditions (i) positively
affect p53 activation and (ii) negatively affect
Mdm2-mediated degradation of p53. Omitted are constitutive supply and
degradation terms for p53 and Mdm2.
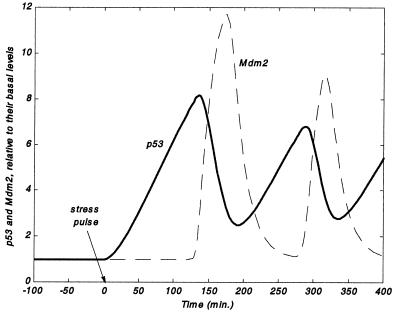
Numerical solution of Eqs. 1-6. p53 and Mdm2
levels (relative to their basal amounts) undergo oscillations after an
initial pulse of stress at t = 0. Mdm2 protein levels
peak with a delay of ≈1 h after the peak in p53 levels. Mdm2 minima
coincide with p53 maxima. Here,
sourcep53 = 0.5;
dp53 = 2.5E-04; p1 = 2.35E-03;
p2max = 0.03; n = 50;
Km = 25;
dMdm2 = 0.05;
c1 = 1.52E-02;
c2 = 0.01;
kdelay = 1.52E-02; repair =
1.E-04; degradationbasal = 2;
kdeg = 1.93;
kdamp = 0.05; p53(t =
0) = 5.3; Mdm2(t = 0) = 0.047;
signal(t = 0) = 1.
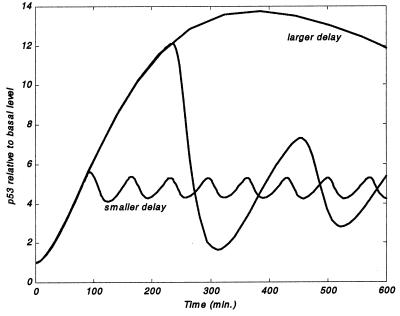
Effect of delay in p53-dependent induction of Mdm2 on the protein
levels (relative to their basal amounts). Only for an intermediate
delay (c1 =
kdelay = 4.0E-03, 50-min time lag
between p53 and Mdm2 peaks), meaningful oscillations are obtained. p53
levels in the intermediate delay case (i) increase to a
larger value than in the small-delay case
(c1 =
kdelay = 0.09, 20-min time lag) and
(ii) remain large for a shorter period that in the
large-delay case (c1 =
kdelay = 9.0E-04, 5-h time lag).
Remaining parameter values are as in Fig. 2.
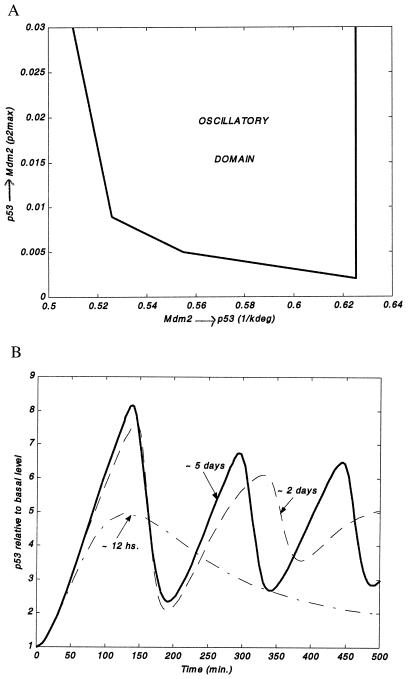
Dependence of oscillations on additional model parameters.
(A) The strengths p53 → Mdm2 (here measured by
p2max, Eq. 2) and Mdm2 → p53 (here measured by
1/kdeg, Eq. 6) define a
plane wherein the oscillatory domain is portrayed. Here we assume a
constant signal throughout the simulation, signal = 1. The arrows
exemplify a conservation requirement for oscillations: If, for
instance, the Mdm2 → p53 interaction is made weaker, then to obtain
oscillations, the p53 → Mdm2 interaction strength should be made
larger. Remaining parameter values are as in Fig. 2. (B)
Dependence of p53 levels (relative to their basal amounts) on the
damage repair rate, repair (Eq. 5). Here
repair is taken to be 1.4E-03 (dash dotted line), 3.5E-04
(dashed line), and 1.4E-04 (solid line). Remaining parameter values are
as in Fig. 2.
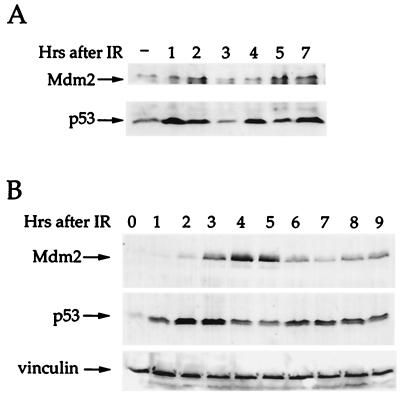
Oscillation in p53 and Mdm2 after IR. (A) Mouse
fibroblasts NIH 3T3 cells expressing wild-type p53 and wild-type Mdm2
were irradiated with 5 Gy of IR and harvested at the indicated time
points after irradiation. Total cell extracts were subjected to
SDS/PAGE followed by Western blot analysis. p53 protein levels were
detected by a mixture of the mAbs PAb248 and PAb421, Mdm2 levels were
detected by probing with the polyclonal serum 1506. (B)
Human breast cancer epithelial MCF-7 cells, expressing wild-type p53
and wild-type Mdm2 were irradiated with 5 Gy of IR and harvested at the
indicated time points after irradiation. Total cell extracts were
subjected to SDS/PAGE followed by Western blot analysis. p53 protein
levels were detected by probing with a mixture of the mAbs DO-1 and
1801, Mdm2 levels were detected by probing with a mixture of the mAbs
4B2 and 2A9.
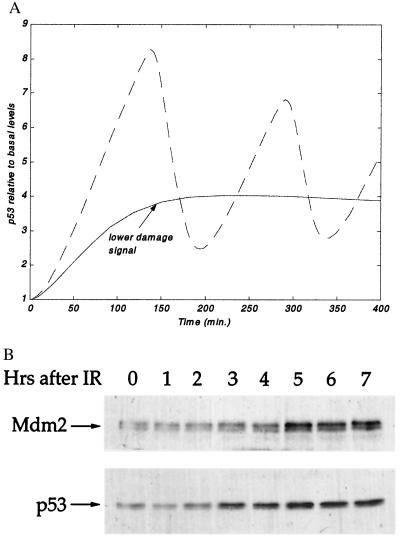
Delayed increase in p53 and Mdm2 after low levels of IR.
(A) Effect of a lower stress signal on p53 levels
(relative to their basal amounts). Here signal(t =
0) = 0.8. Remaining parameter values are as in Fig. 2. The curve
for higher signal (dotted line) is identical to the p53 curve in Fig.
2. (B) MCF-7 cells were irradiated with 0.3 Gy of IR and
harvested at the indicated time points after irradiation. Succeeding
treatment as in Fig. 5B. Total cell extracts were
subjected to SDS/PAGE followed by Western blot analysis. p53 protein
levels were detected by a probing with a mixture of the mAbs DO-1 and
1801, Mdm2 levels were detected by probing with a mixture of the mAbs
4B2 and 2A9.
References
-
- Bennett W P, Hussain S P, Vahakangas K H, Khan M A, Shields P G, Harris C C. J Pathol. 1999;187:8–18. - PubMed
-
- Levine A J. Cell. 1997;88:323–331. - PubMed
-
- Agarwal M L, Taylor W R, Chernov M V, Chernova O B, Stark G R. J Biol Chem. 1998;273:1–4. - PubMed
-
- Prives C, Hall P A. J Pathol. 1999;187:112–126. - PubMed
-
- Oren M. J Biol Chem. 1999;274:36031–36034. - PubMed
Publication types
MeSH terms
Substances
Grants and funding
LinkOut - more resources
Full Text Sources
Other Literature Sources
Research Materials
Miscellaneous
