. 2000 Oct 10;97(21):11232-7.
doi: 10.1073/pnas.210184697.

Involvement of neurogranin in the modulation of calcium/calmodulin-dependent protein kinase II, synaptic plasticity, and spatial learning: a study with knockout mice

Affiliations

Involvement of neurogranin in the modulation of calcium/calmodulin-dependent protein kinase II, synaptic plasticity, and spatial learning: a study with knockout mice

J H Pak et al. Proc Natl Acad Sci U S A. .

Abstract

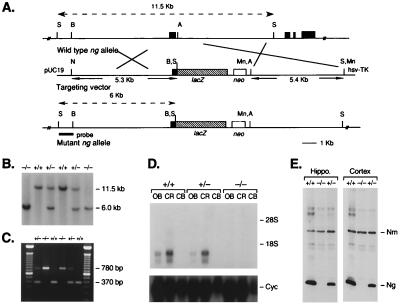
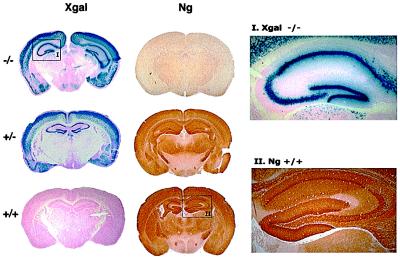
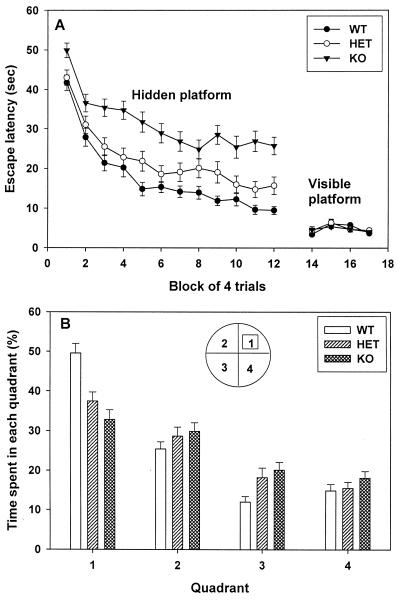
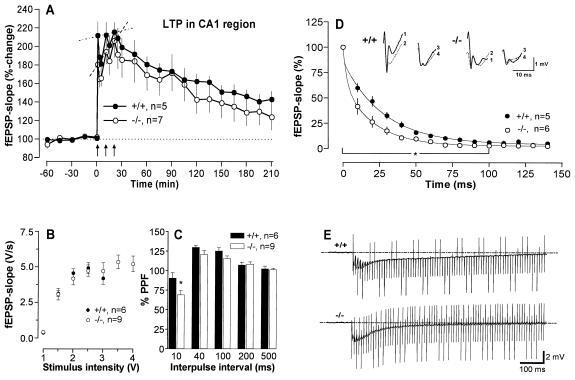
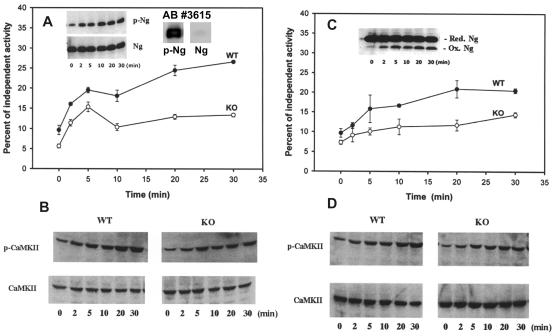
Neurogranin/RC3 is a neural-specific Ca(2+)-sensitive calmodulin (CaM)-binding protein whose CaM-binding affinity is modulated by phosphorylation and oxidation. Here we show that deletion of the Ng gene in mice did not result in obvious developmental or neuroanatomical abnormalities but caused an impairment of spatial learning and changes in hippocampal short- and long-term plasticity (paired-pulse depression, synaptic fatigue, long-term potentiation induction). These deficits were accompanied by a decreased basal level of the activated Ca(2+)/CaM-dependent kinase II (CaMKII) ( approximately 60% of wild type). Furthermore, hippocampal slices of the mutant mice displayed a reduced ability to generate activated CaMKII after stimulation of protein phosphorylation and oxidation by treatments with okadaic acid and sodium nitroprusside, respectively. These results indicate a central role of Ng in the regulation of CaMKII activity with decisive influences on synaptic plasticity and spatial learning.


Figures

Figure 1
Figure 1
Generation of Ng KO mice. (A) Restriction map of the native and mutant Ng alleles and targeting vector. The locations of the Ng gene exon (solid block), herpes simplex virus thymidine kinase gene (hsv-TK), neomycin resistance gene (neo), lacZ gene, and the probe for Southern blot analysis to identify the various genotypes are shown. (B) Southern blot analysis of SacI-digested genomic DNA from mouse tails. (C) PCR analysis of the tail DNA for routine genotyping. (D) Northern blot analysis of Ng mRNA derived from olfactory bulb (OB), cerebral cortex (CR), and cerebellum (CB). Approximately 20 μg of RNA from each tissue was analyzed by using labeled rat Ng cDNA as a probe and referenced with signal probed with cyclophilin (cyc) cDNA. (E) Immunoblot analysis of Ng and Nm in tissue extracts derived from hippocampus and cerebral cortex. The polyclonal antibody (no. 270) detects both Ng and Nm.
Figure 2
Figure 2
Staining of the mouse brain sections with X-gal and Ng-specific antibody. Coronal sections through the hippocampus of the WT (+/+), HET (+/−), and KO (−/−) mice were stained with X-gal or with Ng-specific antibody (no. 2641). The magnified areas show a good correspondence between the X-gal and Ng-positive staining of neurons between +/+ and −/− mice. X-gal staining is restricted to neuronal cell bodies, whereas Ng-positive staining covers both cell bodies and processes.
Figure 3
Figure 3
Learning performance in the Morris water maze. (A) In the first part of the experiment, WT (+/+, n = 40), HET (+/−, n = 43), and KO (−/−, n = 39) mice received 12 blocks of training (3 blocks of 4 trials per day for 4 consecutive days) in the hidden platform version of the maze. The graph shows the escape latency to find the hidden platform for each genotype over successive blocks of trial. Thereafter, each animal was given 4 blocks of the visible platform test (n = 18, 18, and 20 for WT, HET, and KO, respectively). (B) During the probe trial after the twelfth block of training, WT mice spent significantly more time at the trained quadrant no. 1 (49.5 ± 2.4%, n = 40) than did KO mice (32.8 ± 2.4%, n = 39), and HET mice displayed an intermediate performance (37.4 ± 2.2%, n = 43) (one-way ANOVA, P < 0.001). Means ± SEM are given.
Figure 4
Figure 4
LTP, basal synaptic transmission, and short-term plasticity in the hippocampal CA1 region of WT and KO mice. (A) LTP was induced by a repeated strong tetanization protocol consisting of 3 stimulus trains at 100 Hz (0.2 msec per polarity) with a 10-min intertrain interval. During the initial phase of potentiation, WT mice attained nearly the maximal level of potentiation after the first tetanus, whereas KO mice progressively increased the potentiation after each tetanus. For KO (but not WT) mice, the magnitude of the third tetanus potentiation was significantly greater than that of the first (P = 0.018 Wilcoxon matched-pairs signed rank test). Arrows indicate the time of tetanization. (B) Input/output curves of the KO and WT mice. fEPSP slopes were recorded at increasing stimulation intensities until a maximum was attained. There were no significant differences between the two groups. (C) Short-term plasticity as evaluated by paired-pulse stimulation at different IPIs. Although paired-pulse stimulation at an IPI of 10 ms resulted in PPD, at all other IPIs, PPF appeared. Note the stronger PPD of KO mice (P < 0.05). (D) Decay of fEPSPs during the first tetanic stimulation. The slope of 15 consecutive fEPSPs immediately at the onset of tetanic stimulation was determined, averaged across each group, and plotted vs. time. The curves were obtained by nonlinear fits with a two-phase exponential equation. The fEPSPs of KO mice decayed much faster than the WT in the initial part (first 100 ms) of the decay (P = 0.022, ANOVA with repeated measures). Insets show analogue traces of the first four fEPSPs during the first tetanization. Note the marked decay of fEPSP slope of the KO mouse between the first and second recording. (E) Representative analogue recordings of fEPSP changes in a WT vs. KO during the first tetanization. The faster decay of fEPSPs in the KO results in a smaller depolarizing envelope evoked by summation of the fEPSPs (area: WT, 878.4 units; KO, 530.5 units). The applied sampling rate permits a clear distinction of the fEPSPs between the WT and KO.
Figure 5
Figure 5
Okadaic acid- and SNP-induced modifications of Ng and activation of CaMKII. Hippocampal slices from WT and KO mice were incubated with 0.5 μM of okadaic acid (A and B) or 0.5 mM SNP (C and D). At timed intervals, samples were taken and tissue extracts used for the measurement of CaMKII activity in the presence or absence of Ca2+/CaM. Percent of Ca2+/CaM-independent activity was determined. A PO4-Ng antibody (antibody no. 3615), which is specific for the phosphorylated form, was used for the detection of p-Ng (A Inset) and antibody no. 270 for the detection of total Ng (A Inset) and the reduced (Red) and oxidized (Ox) forms (C Inset). For determination of Ng oxidation (C Inset), slices were homogenized in buffer containing 100 mM iodoacetamide without DTT and electrophoresis carried out under nonreducing condition to preserve the extent of oxidation. Autophosphorylated (p-CaMKII) and total αCaMKII were determined by using commercially available antibodies (B and D). The increase in autophosphorylated CaMKII corresponds well with the increase in the Ca2+/CaM-independent activity. The data represent the mean (± SEM) of three separate experiments by using slices from six each of the WT and KO mice.

References

    1. Gerendasy D D, Sutcliffe J G. Mol Neurobiol. 1997;15:131–163. - PubMed
    1. Prichard L, Deloulme J C, Storm D R. J Biol Chem. 1999;274:7689–7694. - PubMed
    1. Chakravarthy B, Morley P, Whitfield J. Trends Neurosci. 1999;22:12–16. - PubMed
    1. Baudier J, Deloulme J C, VanDorsselaer A V, Black D, Matthes H W D. J Biol Chem. 1991;266:229–237. - PubMed
    1. Huang K-P, Huang F L, Chen H-C. Arch Biochem Biophys. 1993;305:570–580. - PubMed

MeSH terms

Substances

Associated data