. 2000 Oct 2;151(1):117-30.
doi: 10.1083/jcb.151.1.117.

Glycogen synthase kinase-3beta is a negative regulator of cardiomyocyte hypertrophy

Affiliations

Glycogen synthase kinase-3beta is a negative regulator of cardiomyocyte hypertrophy

S Haq et al. J Cell Biol. .

Abstract

Hypertrophy is a basic cellular response to a variety of stressors and growth factors, and has been best characterized in myocytes. Pathologic hypertrophy of cardiac myocytes leads to heart failure, a major cause of death and disability in the developed world. Several cytosolic signaling pathways have been identified that transduce prohypertrophic signals, but to date, little work has focused on signaling pathways that might negatively regulate hypertrophy. Herein, we report that glycogen synthase kinase-3beta (GSK-3beta), a protein kinase previously implicated in processes as diverse as development and tumorigenesis, is inactivated by hypertrophic stimuli via a phosphoinositide 3-kinase-dependent protein kinase that phosphorylates GSK-3beta on ser 9. Using adenovirus-mediated gene transfer of GSK-3beta containing a ser 9 to alanine mutation, which prevents inactivation by hypertrophic stimuli, we demonstrate that inactivation of GSK-3beta is required for cardiomyocytes to undergo hypertrophy. Furthermore, our data suggest that GSK-3beta regulates the hypertrophic response, at least in part, by modulating the nuclear/cytoplasmic partitioning of a member of the nuclear factor of activated T cells family of transcription factors. The identification of GSK-3beta as a transducer of antihypertrophic signals suggests that novel therapeutic strategies to treat hypertrophic diseases of the heart could be designed that target components of the GSK-3 pathway.


Figures

Figure 1
Figure 1
Inhibition of GSK-3β by ET-1 in neonatal cardiomyocytes in culture (A), and by pressure overload in vivo (B). A, Cardiomyocytes were exposed to IGF-1 (40 ng/ml) for 20 min, or to vehicle or ET-1 (100 nM) for 20, 40, 60, or 90 min, followed by immune complex kinase assays for GSK-3β activity. Percent inhibition of GSK-3β activity is expressed relative to vehicle controls. Western blot of total GSK-3β in the lysates is shown below the graph. n = 3 experiments, assayed in duplicate. *P < 0.01 vs. vehicle control. B, Rats were subjected to aortic banding or sham banding, and then were killed at 2, 4, 24, or 48 h after banding. GSK-3β immune complex kinase assays were performedon myocardial lysates, and percent inhibition of kinase activity is expressed relative to sham banded animals. n = 3 animals per condition. *P < 0.01 vs. sham banded animals.
Figure 1
Figure 1
Inhibition of GSK-3β by ET-1 in neonatal cardiomyocytes in culture (A), and by pressure overload in vivo (B). A, Cardiomyocytes were exposed to IGF-1 (40 ng/ml) for 20 min, or to vehicle or ET-1 (100 nM) for 20, 40, 60, or 90 min, followed by immune complex kinase assays for GSK-3β activity. Percent inhibition of GSK-3β activity is expressed relative to vehicle controls. Western blot of total GSK-3β in the lysates is shown below the graph. n = 3 experiments, assayed in duplicate. *P < 0.01 vs. vehicle control. B, Rats were subjected to aortic banding or sham banding, and then were killed at 2, 4, 24, or 48 h after banding. GSK-3β immune complex kinase assays were performedon myocardial lysates, and percent inhibition of kinase activity is expressed relative to sham banded animals. n = 3 animals per condition. *P < 0.01 vs. sham banded animals.
Figure 2
Figure 2
Hypertrophic stimuli inhibit GSK-3β via phosphorylation of Ser 9 by a PI3-K-dependent protein kinase. A, ET-1 induces Ser 9 phosphorylation of GSK-3β by a PI3-K–dependent kinase. Cells were pretreated for 30 min with vehicle (DMSO), wortmannin (100 nM), or LY294002 (10 μM), and then were stimulated with vehicle (ET−) or ET-1 (ET+) for 40 min. Western blotting of whole cell lysates was performed with antiphospho Ser 9 GSK-3β and, to confirm that equivalent amounts of protein were loaded, with anti-GSK-3β. Experiment shown is representative of three. B, ET-1–induced inactivation of GSK-3β is PI3-K-dependent. Cardiomyocytes were pretreated for 30 min with wortmannin (100 nM) or vehicle (DMSO), and then were stimulated with ET-1 or vehicle for 40 min, followed by GSK-3β immune complex kinase assay. n = 3 experiments, assayed in duplicate. *P < 0.01 vs. control (ET−/WT−). #P < 0.01 vs. ET-1 alone (ET+/WT−). C, GSK-3βA9 is not inhibited by ET-1 in cardiomyocytes. Cells were transduced with AdGSK-3βA9 (A9) or AdGFP (GFP) at an MOI of 100 pfu/cell, or no virus (C). 36 hours later, cells were stimulated with vehicle or ET-1 for 30 min, lysates were prepared and anti-HA immune complex kinase assays were performed. Experiments were performed in parallel with the experiments presented in Fig. 1 A, demonstrating significant inhibition of GSK-3β by ET-1. *P < 0.01 vs. respective no virus control (C) and GFP virus control.
Figure 2
Figure 2
Hypertrophic stimuli inhibit GSK-3β via phosphorylation of Ser 9 by a PI3-K-dependent protein kinase. A, ET-1 induces Ser 9 phosphorylation of GSK-3β by a PI3-K–dependent kinase. Cells were pretreated for 30 min with vehicle (DMSO), wortmannin (100 nM), or LY294002 (10 μM), and then were stimulated with vehicle (ET−) or ET-1 (ET+) for 40 min. Western blotting of whole cell lysates was performed with antiphospho Ser 9 GSK-3β and, to confirm that equivalent amounts of protein were loaded, with anti-GSK-3β. Experiment shown is representative of three. B, ET-1–induced inactivation of GSK-3β is PI3-K-dependent. Cardiomyocytes were pretreated for 30 min with wortmannin (100 nM) or vehicle (DMSO), and then were stimulated with ET-1 or vehicle for 40 min, followed by GSK-3β immune complex kinase assay. n = 3 experiments, assayed in duplicate. *P < 0.01 vs. control (ET−/WT−). #P < 0.01 vs. ET-1 alone (ET+/WT−). C, GSK-3βA9 is not inhibited by ET-1 in cardiomyocytes. Cells were transduced with AdGSK-3βA9 (A9) or AdGFP (GFP) at an MOI of 100 pfu/cell, or no virus (C). 36 hours later, cells were stimulated with vehicle or ET-1 for 30 min, lysates were prepared and anti-HA immune complex kinase assays were performed. Experiments were performed in parallel with the experiments presented in Fig. 1 A, demonstrating significant inhibition of GSK-3β by ET-1. *P < 0.01 vs. respective no virus control (C) and GFP virus control.
Figure 3
Figure 3
Gene transfer of constitutively active PI3-K (BD110) or PKB/Akt, or treatment with LiCl induces protein synthesis in neonatal rat cardiomyocytes. Neonatal cardiomyocytes were treated with vehicle (Control), ET-1, or LiCl for 48 h (left side), or were transduced with AdBD110 or AdPKB/Akt, or with control virus (AdGFP) for 48 h. Leucine incorporation was determined over the last 12 h of the incubation. *P < 0.01 vs. vehicle control. #P < 0.01 vs. virus control (GFP).
Figure 4
Figure 4
Expression of GSK-3βA9 in neonatal cardiomyocytes. Neonatal myocytes were transduced with AdGFP (GFP) or AdGSK-3βA9 (A9) at an MOI of 100. 36 h later, cell lysates were prepared, and Western blotting with anti-GSK-3β mAb was performed. Due to the HA tag, GSK-3βA9 runs at a slightly higher Mr than does the endogenous kinase. Of note, LiCl did not affect expression of GSK-3βA9 (data not shown).
Figure 5
Figure 5
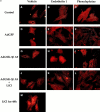
Expression of GSK-3βA9 inhibits ET-1– and PE-induced sarcomere organization. a, Cells were transduced with AdGFP or AdGSK-3βA9, or no virus (Control). 36 h later, cells were treated with vehicle, ET-1, or PE, with or without LiCl present. Sarcomere organization was determined 48 h later. Expression of GSK-3βA9, as opposed to expression of GFP, markedly reduces ET-1– and PE-induced sarcomere organization (compare H with E, and I with F), and this effect of GSK-3βA9 is reversed by LiCl (10 mM; compare K with H, and L with I). M shows the moderate sarcomere organization that is induced by 48 h of LiCl in the absence of ET-1. b, Quantitation of sarcomere organization. Cardiomyocytes, which had been transduced with AdGFP or AdGSK-3βA9 (A9), were treated with vehicle (C), ET-1, or PE, in the presence or absence of LiCl (10 mM) (A9/Li). 48 h later, myocytes (n ≥ 100 per experiment, n = 3 experiments) were scored for the presence or absence of highly organized sarcomeres. *P < 0.01 vs. control/GFP. #P < 0.01 vs. respective GFP and A9/Li conditions.
Figure 5
Figure 5
Expression of GSK-3βA9 inhibits ET-1– and PE-induced sarcomere organization. a, Cells were transduced with AdGFP or AdGSK-3βA9, or no virus (Control). 36 h later, cells were treated with vehicle, ET-1, or PE, with or without LiCl present. Sarcomere organization was determined 48 h later. Expression of GSK-3βA9, as opposed to expression of GFP, markedly reduces ET-1– and PE-induced sarcomere organization (compare H with E, and I with F), and this effect of GSK-3βA9 is reversed by LiCl (10 mM; compare K with H, and L with I). M shows the moderate sarcomere organization that is induced by 48 h of LiCl in the absence of ET-1. b, Quantitation of sarcomere organization. Cardiomyocytes, which had been transduced with AdGFP or AdGSK-3βA9 (A9), were treated with vehicle (C), ET-1, or PE, in the presence or absence of LiCl (10 mM) (A9/Li). 48 h later, myocytes (n ≥ 100 per experiment, n = 3 experiments) were scored for the presence or absence of highly organized sarcomeres. *P < 0.01 vs. control/GFP. #P < 0.01 vs. respective GFP and A9/Li conditions.
Figure 7
Figure 7
Effect of GSK-3βA9 on ET-1–induced protein synthesis. Neonatal cardiomyocytes were transduced at an MOI of 125 pfu/cell with AdGSK-3βA9 or AdGFP for 36 h, or no virus (C), and then were treated with ET-1 (+) or vehicle (−), with or without LiCl present. [3H]-leucine incorporation was determined 48 h later. n = 6 experiments, each condition assayed in triplicate. *P < 0.01 vs. respective vehicle control. #P < 0.01 vs. A9/ET-1.
Figure 6
Figure 6
Expression of GSK-3βA9 inhibits ET-1–induced ANF expression. A, ET-1 induces ANF expression in cardiomyocytes. Myocytes were treated with vehicle or ET-1, and 48 h later were stained for ANF expression. Two vehicle-treated cells were positive for ANF expression whereas the majority of ET-1–treated cells were positive. B, Effect of GSK-3βA9 on ANF expression. Cardiomyocytes were transduced with either AdGFP or AdGSK-3βA9 (MOI = 50 pfu/cell), and then were exposed to ET-1 with or without LiCl present. The left panels show staining for ANF expression and the right panels show GFP expression, thus identifying the cells in each field that were successfully transduced with the virus. The control virus (AdGFP) does not prevent ET-1–induced ANF expression (A and B). For the cells transduced with AdGSK-3βA9, in the absence of LiCl (C and D), of the seven cells expressing ANF, none were transduced with AdGSK-3βA9 (compare C and D). In contrast, none of the cells that were transduced with AdGSK-3βA9 (green) express ANF. However, numerous cells transduced with AdGSK-3βA9 express ANF when LiCl is present (E and F), and LiCl restores ET-1 responsiveness in GSK-3βA9-expressing cells (G and H). C, Quantitation of the effect of GSK-3βA9 on ANF expression. Cells were transduced with AdGFP (GFP), or AdGSK-3βA9 (A9), and then were exposed to ET-1 or vehicle, with or without LiCl present (A9/Li). The percent of transduced cells (i.e., GFP positive) expressing ANF was then determined for the various conditions. Also shown is ANF expression in control cells not transduced with virus (C). At least 100 myocytes were scored for each experiment. *P < 0.01 vs. vehicle-treated control cells (C/ET−), GFP infected cells (GFP/ET−), and A9 infected cells (A9/ET−). #P < 0.01 vs. all ET-1–treated cells. D, Immunoblot confirming the findings from B and C. Cardiomyocytes were infected with AdGSK-3βA9 (A9) (MOI = 100 pfu/cell) or no virus (C), and then were exposed to vehicle or ET-1, with or without LiCl present. Expression of GSK-3βA9 prevented ET-1–induced ANF expression, and LiCl reversed the inhibition. Also shown is the effect of LiCl alone, which induces moderate ANF expression. Below the immunoblot is a graph showing quantitation of ANF expression by band densitometry from n = 3 experiments. *P < 0.05 vs. C, A9/Control, and A9/ET.
Figure 6
Figure 6
Expression of GSK-3βA9 inhibits ET-1–induced ANF expression. A, ET-1 induces ANF expression in cardiomyocytes. Myocytes were treated with vehicle or ET-1, and 48 h later were stained for ANF expression. Two vehicle-treated cells were positive for ANF expression whereas the majority of ET-1–treated cells were positive. B, Effect of GSK-3βA9 on ANF expression. Cardiomyocytes were transduced with either AdGFP or AdGSK-3βA9 (MOI = 50 pfu/cell), and then were exposed to ET-1 with or without LiCl present. The left panels show staining for ANF expression and the right panels show GFP expression, thus identifying the cells in each field that were successfully transduced with the virus. The control virus (AdGFP) does not prevent ET-1–induced ANF expression (A and B). For the cells transduced with AdGSK-3βA9, in the absence of LiCl (C and D), of the seven cells expressing ANF, none were transduced with AdGSK-3βA9 (compare C and D). In contrast, none of the cells that were transduced with AdGSK-3βA9 (green) express ANF. However, numerous cells transduced with AdGSK-3βA9 express ANF when LiCl is present (E and F), and LiCl restores ET-1 responsiveness in GSK-3βA9-expressing cells (G and H). C, Quantitation of the effect of GSK-3βA9 on ANF expression. Cells were transduced with AdGFP (GFP), or AdGSK-3βA9 (A9), and then were exposed to ET-1 or vehicle, with or without LiCl present (A9/Li). The percent of transduced cells (i.e., GFP positive) expressing ANF was then determined for the various conditions. Also shown is ANF expression in control cells not transduced with virus (C). At least 100 myocytes were scored for each experiment. *P < 0.01 vs. vehicle-treated control cells (C/ET−), GFP infected cells (GFP/ET−), and A9 infected cells (A9/ET−). #P < 0.01 vs. all ET-1–treated cells. D, Immunoblot confirming the findings from B and C. Cardiomyocytes were infected with AdGSK-3βA9 (A9) (MOI = 100 pfu/cell) or no virus (C), and then were exposed to vehicle or ET-1, with or without LiCl present. Expression of GSK-3βA9 prevented ET-1–induced ANF expression, and LiCl reversed the inhibition. Also shown is the effect of LiCl alone, which induces moderate ANF expression. Below the immunoblot is a graph showing quantitation of ANF expression by band densitometry from n = 3 experiments. *P < 0.05 vs. C, A9/Control, and A9/ET.
Figure 8
Figure 8
Effect of GSK-3βA9 on ET-1–induced nuclear translocation of NF-AT. A, ET-1 induces nuclear translocation of NF-AT. Cardiomyocytes were stimulated with ET-1 for the times noted. Cytosolic and nuclear fractions were prepared, matched for protein, and immunoblotted with anti–NF-AT antibody. This and all other immunoblots shown in this figure are representative of three experiments. B, ET-1 induces nuclear translocation of GSK-3β. Cells were stimulated with ET-1 for the times noted and then were subjected to cell fractionation. Nuclear fractions were matched for protein, and immunoblotted with anti–GSK-3β. C, Expression of GSK-3βA9 reduces ET-1–induced nuclear translocation of NF-AT. Cardiomyocytes were infected with AdGFP (top), or AdGSK-3βA9 (bottom), and 36 h later were stimulated with ET-1 for the times noted. Cytosolic and nuclear fractions were matched for protein, and immunoblotted with anti–NF-AT antibody. Below the immunoblots is a graph showing quantitation of NF-AT cytosolic and nuclear localization by band densitometry from n = 3 experiments. Each value is normalized to the respective cytosolic band density at 0 min. *P < 0.05 for AdGSK-3βA9 infected cells vs. AdGFP infected cells.
Figure 8
Figure 8
Effect of GSK-3βA9 on ET-1–induced nuclear translocation of NF-AT. A, ET-1 induces nuclear translocation of NF-AT. Cardiomyocytes were stimulated with ET-1 for the times noted. Cytosolic and nuclear fractions were prepared, matched for protein, and immunoblotted with anti–NF-AT antibody. This and all other immunoblots shown in this figure are representative of three experiments. B, ET-1 induces nuclear translocation of GSK-3β. Cells were stimulated with ET-1 for the times noted and then were subjected to cell fractionation. Nuclear fractions were matched for protein, and immunoblotted with anti–GSK-3β. C, Expression of GSK-3βA9 reduces ET-1–induced nuclear translocation of NF-AT. Cardiomyocytes were infected with AdGFP (top), or AdGSK-3βA9 (bottom), and 36 h later were stimulated with ET-1 for the times noted. Cytosolic and nuclear fractions were matched for protein, and immunoblotted with anti–NF-AT antibody. Below the immunoblots is a graph showing quantitation of NF-AT cytosolic and nuclear localization by band densitometry from n = 3 experiments. Each value is normalized to the respective cytosolic band density at 0 min. *P < 0.05 for AdGSK-3βA9 infected cells vs. AdGFP infected cells.

References

    1. Aberle H., Bauer A., Stappert J., Kispert A., Kemler R. β-catenin is a target for the ubiquitin–proteasome pathway. EMBO (Eur. Mol. Biol. Organ.) J. 1997;16:3797–3804. - PMC - PubMed
    1. Avruch J. Insulin signal transduction through protein kinase cascades. Mol. Cell. Biochem. 1998;182:31–48. - PubMed
    1. Beals C.R., Clipstone N.A., Ho S.N., Crabtree G.R. Nuclear localization of NF-ATc by a calcineurin-dependent, cyclosporin-sensitive intramolecular interaction Genes Dev. 11 1997. 824 834a - PubMed
    1. Beals C.R., Sheridan C.M., Turck C.W., Gardner P., Crabtree G.R. Nuclear export of NF-ATc enhanced by glycogen synthase kinase-3 Science. 275 1997. 1930 1934b - PubMed
    1. Boyle W.J., Smeal T., Defize L.H., Angel P., Woodgett J.R., Karin M., Hunter T. Activation of protein kinase C decreases phosphorylation of c-Jun at sites that negatively regulate its DNA-binding activity. Cell. 1991;64:573–584. - PubMed

Publication types

MeSH terms