. 2000 Oct 1;528 Pt 1(Pt 1):25-37.
doi: 10.1111/j.1469-7793.2000.00025.x.

Effect of intracellular pH on spontaneous Ca2+ sparks in rat ventricular myocytes

Affiliations

Effect of intracellular pH on spontaneous Ca2+ sparks in rat ventricular myocytes

C D Balnave et al. J Physiol. .

Abstract

1. A fall of intracellular pH (pHi) typically depresses cardiac contractility. Among the many mechanisms underlying this depression, an inhibitory effect of acidosis upon the sarcoplasmic reticulum (SR) Ca2+ release channel has been predicted, but not so far demonstrated in the intact cardiac myocyte. In the present work, pHi was manipulated experimentally while confocal imaging was used to record spontaneous 'Ca2+ sparks' (local SR Ca2+ release events) in rat isolated myocytes loaded with the fluorescent Ca2+ indicator fluo-3. In other experiments, whole cell (global) pHi or [Ca2+]i was measured by microfluorimetry (using, respectively, intracellular carboxy SNARF-1 and indo-1). 2. Reducing pHi (i) increased whole cell intracellular [Ca2+] transients induced either electrically or by addition of caffeine, whereas (ii) it decreased spontaneous Ca2+ spark frequency. Conversely, raising pHi increased spontaneous Ca2+ spark frequency. 3. Blocking sarcolemmal Ca2+ influx with 10 mM Ni2+, or reducing external pH by 1.0 unit, had no effect on the pHi-dependent changes in spontaneous Ca2+ spark frequency. 4. Decreasing pHi over the range 7.78-7.20, decreased Ca2+ spark frequency exponentially as a function of pHi, with frequency declining by approximately 33 % for a 0.2 unit fall in pHi. In contrast, over the same pHi range, Ca2+ spark amplitude was unaffected. Intracellular acidosis produced a slight slowing of Ca2+ spark relaxation. 5. The results indicate that, in the intact myocyte, a reduced pHi decreases the probability of opening of the SR Ca2+ release channel. This phenomenon may contribute to the negative inotropic effects of acidosis.


Figures
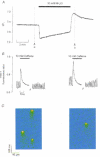
Figure 1
Figure 1
Effect of pHi on intracellular pH and Ca2+ Traces of pHi, indo-1 fluorescence ratio and images of Ca2+ sparks. A, representative recording of whole cell pHi, showing the introduction of an intracellular acid load by withdrawal of 10 mm NH4Cl. B, recording of intracellular indo-1 fluorescence ratio indicating changes in global cytoplasmic [Ca2+] at control pHi (left trace) and during an acidosis (right trace). The left-hand and right-hand recordings were made at the times indicated by a and b in A. The [Ca2+]i transients shown in B were induced either by field stimulation (0.33 Hz), or by application of 10 mm caffeine. After caffeine application, the cell was allowed to recover for 40 s before stimulation was continued (indicated by the break in the indo-1 recording). C, examples of confocal line-scan images of Ca2+ sparks measured at control pHi (left image) and during an acidosis (right trace); the images were taken at times corresponding to a and b in A. Images have been false coloured by computer with blue representing low fluorescence intensity (i.e. low [Ca2+]i) and green, yellow and red representing respectively higher fluorescence intensities. Recordings in A, B and C were made in different cells.
Figure 2
Figure 2
Effect of pHi on spontaneous Ca2+ sparks Confocal line-scan images of Ca2+ sparks at control pHi and during acidosis or alkalosis. Parts A and B, illustrated on the left-hand and right-hand pages, respectively, were taken from different experiments. In both A and B, the top panels show 20 consecutive images taken at the control pHi of 7.46 (Ai and Bi). The lower panels show the effect of reducing pHi (left; Aii) and raising pHi (right; Bii) by the amounts indicated. Data collection in the two lower panels commenced 1 min after removal of either 10 mm NH4Cl (Aii) or 80 mm acetate (Bii) from the superfusate. False colouring by computer indicates low to high fluorescence intensity spectrally as blue to red. Scale bar in B also applies to A.
Figure 3
Figure 3
Effect of an intracellular acidosis on Ca2+ spark frequency Ca2+ spark frequency was calculated from a gallery of 20 images taken at the beginning of the experiment (basal frequency) and then again (A) after a control period of 10 min (or 1 min when superfusate pH was 6.4), and (B) 1 min after the introduction of an intracellular acid load (5 min, 10 mm NH4Cl prepulse). Ca2+ spark frequency is expressed as a percentage of the basal frequency. The experiment was performed in NT solution (□), in NT solution containing 10 mm NiCl2 (formula image), and in NT solution of pH 6.4 (formula image). Decrease in pHis.e.m.) relative to basal pHi is shown beneath columns on x-axis. *Significant fall of spark frequency (P < 0.01).
Figure 4
Figure 4
Relationship between pHi and Ca2+ spark frequency Change in Ca2+ spark frequency is expressed as a fraction of the frequency at control pHi (n/n0) and plotted on a log scale versus pHi (n = 11 at pHi 7.61; n = 12 at all other points). A linear regression line of best fit has been drawn through the data points. Inset shows the exponential shape of the relationship, revealed when n/n0 is plotted on a linear axis.
Figure 5
Figure 5
Effect of pHi on Ca2+ spark duration and amplitude A, image of a Ca2+ spark, rotated so that time is displayed on the horizontal axis and fluo-3 fluorescence intensity with distance along the cell is displayed on the vertical axis. False colouring by computer indicates fluo-3 fluorescence intensity spectrally from blue (low) to red (high). The pixel values along the dotted line have been plotted below the image and show the fluorescence intensity profile of the Ca2+ spark. Bi, mean of 11 Ca2+ spark fluorescence intensity profiles for Ca2+ sparks (normalised to the same peak intensity) at both control (black trace) and acidotic pHi (red trace, ΔpHi = −0.19). Bii, normalised histograms of Ca2+ spark amplitudes, measured as Ca2+ spark fluorescence intensity divided by background fluorescence intensity (F/F0) and binned at intervals of 0.1 F/F0 units, at control pHi (grey shaded bars) and during an intracellular acidosis of 0.19 pH units (red open bars). Ci, mean of nine Ca2+ spark fluorescence intensity profiles for Ca2+ sparks (normalised to the same peak intensity) at both control (black trace) and alkaline pHi (blue trace; ΔpHi = 0.32). Cii, normalised histograms of Ca2+ spark amplitudes at control pHi (grey shaded bars) and during an intracellular alkalosis of 0.32 pH units (blue open bars).

References

    1. Allen DG, Orchard CH. The effects of changes of pH on intracellular calcium transients in mammalian cardiac muscle. The Journal of Physiology. 1983;335:555–567. - PMC - PubMed
    1. Berlin JR, Cannell MB, Lederer WJ. Cellular origins of the transient inward current in cardiac myocytes. Role of fluctuations and waves of elevated intracellular calcium. Circulation Research. 1989;65:115–126. - PubMed
    1. Bountra C, Vaughan-Jones RD. Effect of intracellular and extracellular pH on contraction in isolated, mammalian cardiac muscle. The Journal of Physiology. 1989;418:163–187. - PMC - PubMed
    1. Bridge JHB, Ershler PR, Cannell MB. Properties of Ca2+ sparks evoked by action potentials in mouse ventricular myocytes. The Journal of Physiology. 1999;518:469–478. - PMC - PubMed
    1. Buckler KJ, Vaughan-Jones RD. Application of a new pH-sensitive fluoroprobe (carboxy-SNARF-1) for intracellular pH measurement in small, isolated cells. Pflügers Archiv. 1990;417:234–239. - PubMed

Publication types

MeSH terms

LinkOut - more resources