. 2000 Oct 1;528 Pt 1(Pt 1):39-52.
doi: 10.1111/j.1469-7793.2000.00039.x.

Zn2+ current is mediated by voltage-gated Ca2+ channels and enhanced by extracellular acidity in mouse cortical neurones

Affiliations

Zn2+ current is mediated by voltage-gated Ca2+ channels and enhanced by extracellular acidity in mouse cortical neurones

G A Kerchner et al. J Physiol. .

Abstract

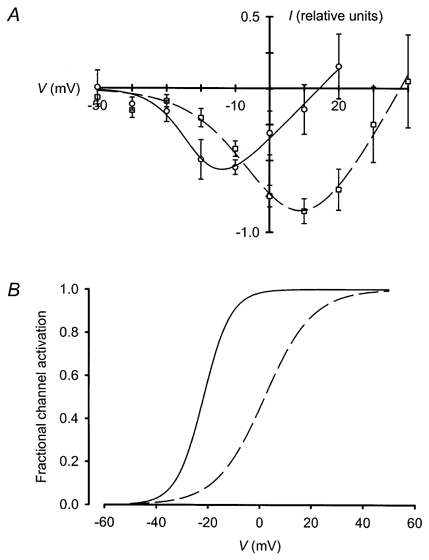
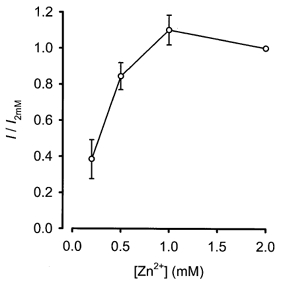
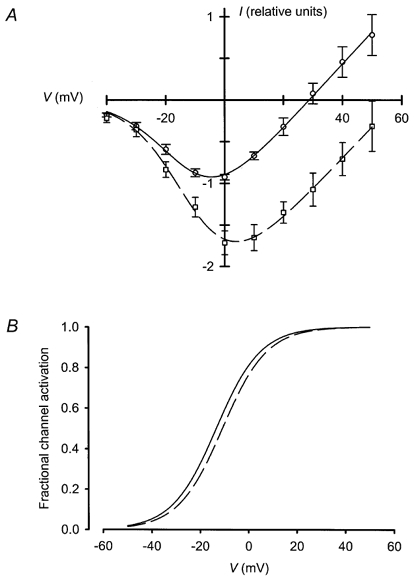
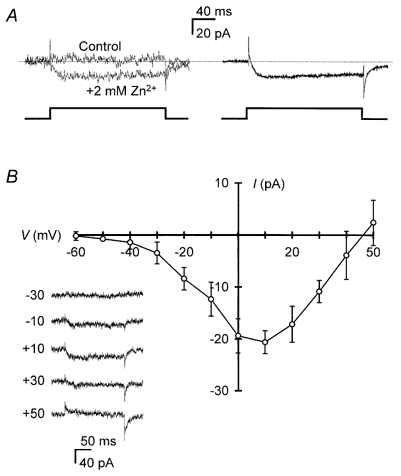
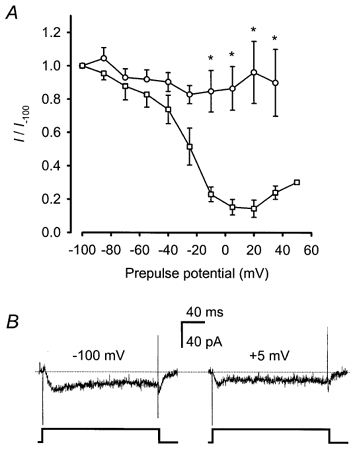
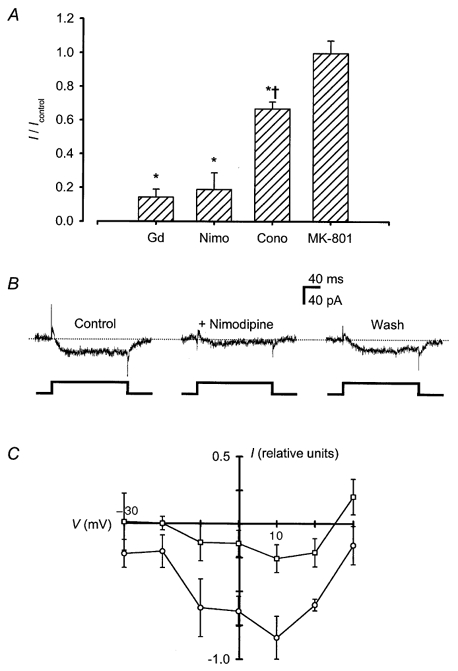
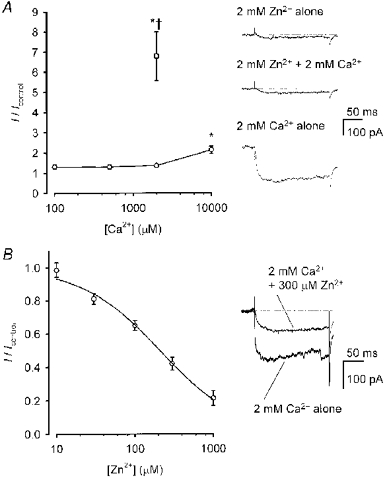
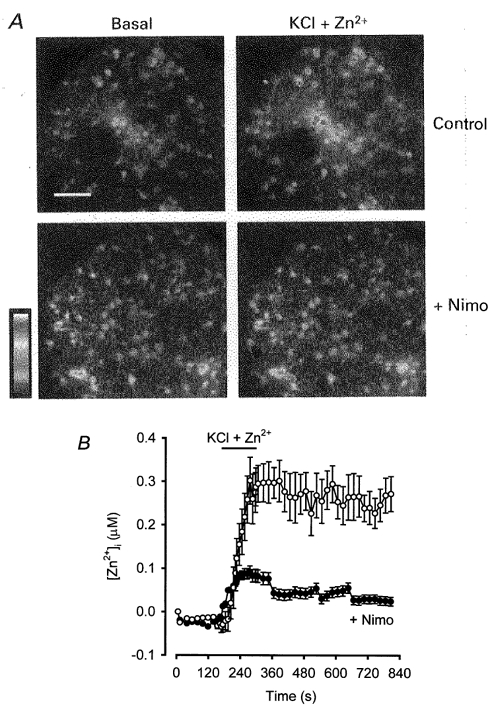
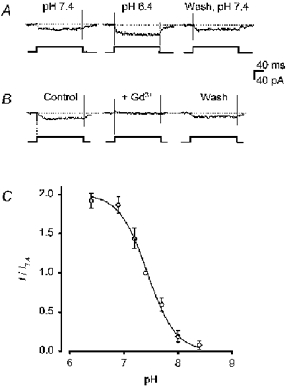
1. Mammalian neuronal voltage-gated Ca2+ channels have been implicated as potential mediators of membrane permeability to Zn2+. We tested directly whether voltage-gated Ca2+ channels can flux Zn2+ in whole-cell voltage-clamp recordings from cultured murine cortical neurones. 2. In the presence of extracellular Zn2+ and no Na+, K+, or other divalent cations, a small, non-inactivating, voltage-gated inward current was observed exhibiting a current-voltage relationship characteristic of high-voltage activated (HVA) Ca2+ channels. Inward current was detectable at Zn2+ levels as low as 50 microM, and both the amplitude and voltage sensitivity of the current depended upon Zn2+ concentration. This Zn2+ current was sensitive to blockade by Gd3+ and nimodipine and, to a lesser extent, by omega-conotoxin GVIA. 3. Zn2+ could permeate Ca2+ channels in the presence of Ca2+ and other physiological cations. Inward currents recorded with 2 mM Ca2+ were attenuated by Zn2+ (IC50 = 210 microM), and currents recorded with Zn2+ were unaffected by up to equimolar Ca2+ concentrations. Furthermore, the Zn2+-selective fluorescent dye Newport Green revealed a depolarisation-activated, nimodipine-sensitive Zn2+ influx into cortical neurones that were bathed in a physiological extracellular solution plus 300 microM ZnCl2. 4. Surprisingly, while lowering extracellular pH suppressed HVA Ca2+ currents, Zn2+ current amplitude was affected oppositely, varying inversely with pH with an apparent pK of 7.4. The acidity-induced enhancement of Zn2+ current was associated with a positive shift in reversal potential but no change in the kinetics or voltage sensitivity of channel activation. 5. These results provide evidence that L- and N-type voltage-gated Ca2+ channels can mediate Zn2+ entry into cortical neurones and that this entry may be enhanced by extracellular acidity.


Figures

Figure 4
Figure 4
Zn2+ concentration affected both maximal current amplitude and voltage sensitivity A, increasing [Zn2+]o from 50 μm (○-○) to 2 mm (□ – – □) resulted in both an increased maximum steady-state current amplitude (P < 0·05, Student's paired t test comparing I–V curve peaks in 50 μm and 2 mm Zn2+), and a rightward shift of the I–V relationship. Five cells were tested, each at both Zn2+ concentrations to maximise comparability of the data, and I–V curves for each cell were normalised to the peak steady-state inward current in 2 mm Zn2+. As each cell was first tested in 50 μm Zn2+ and then in 2 mm Zn2+, some current run-down is the likely explanation for why the current at 0 mV in 2 mm Zn2+ was not as much larger than the current in 50 μm Zn2+ as would be predicted from the data in Fig. 3. Points represent means ± s.e.m. Curves fitted to the points are described by the equation:(see Methods). In 2 mm Zn2+, Vh = 2·1 mV, m = 9·4, Vrev = 38 mV, and g = 0·044; in 50 μm Zn2+, Vh = −22 mV, m = 5·3, Vrev = 14 mV, and g = 0·025. B, increasing [Zn2+]o from 50 μm (continuous line) to 2 mm (dashed line) resulted in a shift of the voltage sensitivity of channel activation to more depolarised potentials. Boltzmann curves, described by the equation Irelative = {1 + exp[(Vh− V) m−1]}−1, are plotted using values for Vh and m derived from curve fits to the I–V data (A) to ease comparison of those two variables between conditions.
Figure 3
Figure 3
Inward current amplitude at 0 mV depended upon extracellular Zn2+ concentration Increasing [Zn2+]o increased the amplitude of steady-state currents elicited by voltage steps to 0 mV. Points represent means ± s.e.m. of 4–7 cells and are plotted relative to currents elicited in the presence of 2 mm Zn2+.
Figure 9
Figure 9
Extracellular acidity enhanced Zn2+ current amplitude with no effect on voltage sensitivity A, the I–V relationships of currents recorded in the presence of 500 μm Zn2+ at pHo 7·4 (○-○) and pHo 6·4 (□ – – □) were plotted. Twelve cells were tested, each at both pHo values, and I–V curves for each cell were normalised to the peak inward steady-state current at pHo 7·4. Points represent means ± s.e.m., and curves were fitted as in Fig. 4. At pHo 7·4, Vh = −13 mV, m = 9·2, Vrev = 29 mV, and g = 0·038; at pHo 6·4, Vh = −11 mV, m = 9·3, Vrev = 59 mV, and g = 0·037. B, decreasing pHo from 7·4 (continuous line) to 6·4 (dashed line) resulted in little to no shift of the voltage sensitivity of channel activation. Curves were plotted as in Fig. 4.
Figure 1
Figure 1
Zn2+ produced an inward current in cultured cortical neurones A, an inward current was elicited in the presence but not the absence (Control) of 2 mm Zn2+ by a voltage step to +10 mV. Illustrated are superimposed traces from a representative cell (left; data filtered at 0·5 kHz for display) and the averaged current from 33 cells in 2 mm Zn2+ (right; no additional filter). Dotted line indicates the baseline zero current level for these leak-subtracted traces (see Methods). B, the I–V relationship of steady-state current recorded during voltage steps from −70 mV in the presence of 2 mm Zn2+ is shown as the mean ± s.e.m. of 5 cells. Sample traces over a range of voltages (mV) are illustrated for a representative cell (inset; current traces here and in subsequent figures were filtered at 1 or 2 kHz to optimise legibility). ‘Steady-state current’ in these and the other experiments reported here refers to an average of the sustained component of current, minus baseline, during a voltage step; for instance, the average current recorded during the last 100 ms of a 200 ms pulse. A reversal potential appears in this I–V relationship, and an outward current was evident at positive potentials. This outward current was probably not carried by Zn2+ that had accumulated within a cell during experiments, as recorded cells were perfused with BAPTA (2 mm; Kd for Zn2+ = 1–10 nm; Aballay et al. 1995). More likely, intracellular cations such as Na+ and Li+ (Table 1), as well as some residual K+, may have accounted for the outward conductance, by analogy with the known effect of intracellular monovalent cations to influence the experimentally observed reversal potential of voltage-gated Ca2+ currents (Hille, 1992).
Figure 2
Figure 2
Zn2+ current exhibited no voltage-dependent steady-state inactivation A, after 1 s prepulses to the indicated potentials, the amplitude of steady-state inward currents elicited by immediately subsequent voltage steps to 0 mV in the presence of 500 μm Zn2+ (○; n = 6) or 2 mm Ca2+ (□; n = 3) are plotted relative to values obtained after a prepulse to −100 mV. In each cell tested, families of voltage pulses were delivered twice – once in an ascending order (−100 to +50 mV), and once in a descending order, to help compensate for any non-voltage-dependent current run-down. * Significant difference between relative current amplitudes recorded in Zn2+versus Ca2+ after the indicated prepulse potentials (two-way ANOVA with Bonferroni's t test). Points represent means ± s.e.m.B, traces obtained by voltage steps from −70 to 0 mV after a 1 s prepulse to −100 mV (left) or +5 mV (right) are illustrated for the cell for which the greatest degree of inactivation was observed in the presence of 500 μm Zn2+. The dotted line indicates the zero current level. The sustained component (latter 100 ms) of the inward currents were compared to generate the graph in A.
Figure 5
Figure 5
Zn2+ current was sensitive to blockade by non-specific and specific blockers of voltage-gated Ca2+ channels A, steady-state Zn2+ current was inhibited by 10 μm Gd3+ (Gd), 1 μm nimodipine (Nimo), and 1 μm ω-conotoxin GVIA (Cono), but not by 1 μm MK-801. Zn2+ current was evoked by a voltage step to +10 mV in the presence of 2 mm Zn2+. The level of steady-state current recorded in the presence of an antagonist was normalised to current amplitude measured with Zn2+ alone and plotted as the mean + s.e.m. of 3–8 cells per condition. Cells were perfused with drugs or control solution for 30 s between voltage step trials. * Significant difference between normalised steady-state current amplitudes measured in the presence and absence of an agent; † Significant difference compared to currents measured after treatment with nimodipine or Gd3+ (P < 0·05, one-way ANOVA with Bonferroni's t test). B, current traces from a representative cell demonstrate reversible inhibition of Zn2+ current by 1 μm nimodipine; the cell was treated as in A. The dotted line represents the zero current level. C, the I–V relationship of steady-state currents recorded in the presence of 2 mm Zn2+ in the absence (○) or presence (□) of 1 μm nimodipine is plotted. I–V curves from 3 cells were normalised, each to its peak, and averaged. Points represent means ± s.e.m.
Figure 6
Figure 6
Zn2+ competed with Ca2+ for voltage-gated Ca2+ channel permeation A, inward currents, evoked by voltage steps from −70 to +10 mV, were recorded from cells in the presence of 2 mm Zn2+ plus varying concentrations of Ca2+ (○; n = 7–14 cells per condition). Steady-state current amplitude is plotted relative to control currents evoked in the presence of 2 mm Zn2+ alone (left). Relative current amplitude recorded in the presence of 2 mm Ca2+ and no Zn2+ is plotted for comparison (□; n = 4). Points represent means ± s.e.m. Representative traces (right) show currents recorded in the presence of 2 mm Zn2+ with or without 2 mm Ca2+; a representative trace from another neurone in the same culture dish, recorded in the presence of 2 mm Ca2+ alone, is illustrated for comparison. Dotted lines indicate the zero current level. * Significant difference between current amplitude in the indicated condition and control currents evoked in the presence of Zn2+ alone; † significant difference in current amplitudes recorded in the presence of 2 mm Ca2+ with versus without 2 mm Zn2+ (P < 0·05, one-way ANOVA with Bonferroni's t test). B, inward currents, evoked by voltage steps from −70 to 0 mV, were recorded from 4 cells in the presence of 2 mm Ca2+ plus varying concentrations of Zn2+. Steady-state current amplitude is plotted relative to currents evoked in the presence of 2 mm Ca2+ alone (left). Points represent means ± s.e.m. The points were fitted by a curve described by the equation:where IC50 = 210 μm and m = −1·2. Superimposed traces from a representative cell illustrate the effects of 300 μm Zn2+ on current recorded in the presence of 2 mm Ca2+ (right).
Figure 7
Figure 7
Voltage-gated Ca2+ channels mediated depolarisation-induced rises in [Zn2+]i in physiological saline A, cortical neuronal cultures loaded with Newport Green and bathed in Hepes-buffered saline (see Methods) were exposed for 2 min to either high-potassium + 300 μm Zn2+ (control) or high-potassium + 300 μm Zn2+ + 10 μm nimodipine (high-potassium solutions contained 60 mm KCl, 65 mm NaCl, and were otherwise identical to the Hepes-buffered saline). MK-801 (10 μm) and NBQX (10 μm) were present throughout experiments to block glutamate receptor activation by endogenous glutamate release. Pseudo-colour images from a representative experiment depict changes in [Zn2+]i according to the Newport Green fluorescence values indicated in the scale. The fluorescence signal attributed to increased [Zn2+]i was completely quenched by the addition of the selective membrane-permeable Zn2+ chelator, 100 μm TPEN (not shown). Scale bar = 50 μm. B, each trace represents the change in [Zn2+]i observed in the same experiments described in A (control, n = 57 cells; nimodipine (Nimo), n = 52). Fluorescence values were converted to Zn2+ concentrations by a calibration performed at the end of the experiment (see Methods).
Figure 8
Figure 8
Extracellular acidity enhanced Zn2+ current A, representative traces elicited by a voltage step to 0 mV in the presence of 500 μm Zn2+ show reversible changes in steady-state current amplitude at pHo 6·4 compared to pHo 7·4. Cells were exposed to a new extracellular buffer solution for 30–60 s between trials. This change in pHo resulted in no change in the linearity of membrane currents throughout the range of voltages used by the leak subtraction protocol (see Methods; data not shown). B, representative traces recorded as in A at pHo 6·4 show reversible blockade by 10 μm Gd3+. C, steady-state Zn2+ current amplitudes at various test pHo values are plotted relative to control currents at pHo 7·4. Voltage steps to 0 mV were delivered to cells in the presence of 500 μm Zn2+; a cell was perfused with a new extracellular buffer solution for 30–60 s between trials. Points represent means ± s.e.m. of 3–6 cells per condition and were fitted with a curve described by the equation:where (I/I7·4)max = 2·0, pK = 7·4, and m = −1·7.

References

    1. Aballay A, Sarrouf MN, Colombo MI, Stahl PD, Mayorga LS. Zn2+ depletion blocks endosome fusion. Biochemical Journal. 1995;312:919–923. - PMC - PubMed
    1. Almers W, McCleskey EW. Non-selective conductance in calcium channels of frog muscle: calcium selectivity in a single-file pore. The Journal of Physiology. 1984;353:585–608. - PMC - PubMed
    1. Ascher P, Nowak L. The role of divalent cations in the N-methyl-D-aspartate responses of mouse central neurones in culture. The Journal of Physiology. 1988;399:247–266. - PMC - PubMed
    1. Assaf SY, Chung SH. Release of endogenous Zn2+ from brain tissue during activity. Nature. 1984;308:734–736. - PubMed
    1. Atar D, Backx PH, Appel MM, Gao WD, Marban E. Excitation-transcription coupling mediated by zinc influx through voltage-dependent calcium channels. Journal of Biological Chemistry. 1995;270:2473–2477. - PubMed

Publication types

MeSH terms

LinkOut - more resources